ES Wednesday 3-4-2015
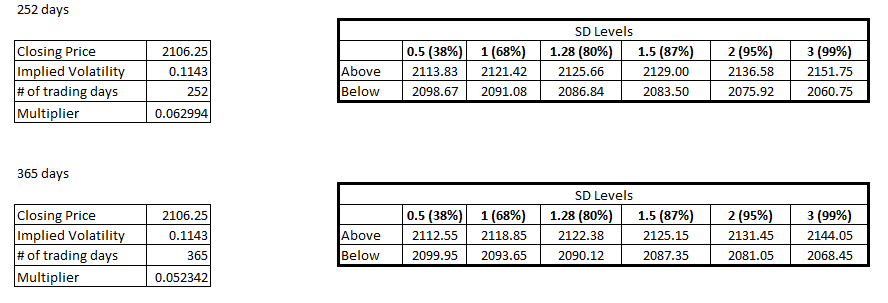
Bands for the day. Good luck to all.
Click image for original size
Joe, it is an untested developing VPOC from the past. Using Bruce's colorful terminology here. 85 was a developing VPOC on 2/20
they pushed us all out of our longs whether in small profits or stops just to see this push back to the open. Es is amazingly good at testing your emotions to the extreme
what Joe mentioned about the 6 day low being taken out made me go back to my charts. and guess what.... that is precisely what I had marked and told myself to be on the lookout for.... and then the day opened and I completely spaced out... even when Joe mentioned it, I was initially taken by surprise.... frustrating when you have the exact roadmap mapped out but fail to execute it... i would really be better off if someone else did the trading for me while i provided guidance.... i need to start thinking of myself as 2 persons... the analyst and the executor of trades... and they each have their own jobs to do
Originally posted by NewKid
what Joe mentioned about the 6 day low being taken out made me go back to my charts. and guess what.... that is precisely what I had marked and told myself to be on the lookout for.... and then the day opened and I completely spaced out... even when Joe mentioned it, I was initially taken by surprise.... frustrating when you have the exact roadmap mapped out but fail to execute it... i would really be better off if someone else did the trading for me while i provided guidance.... i need to start thinking of myself as 2 persons... the analyst and the executor of trades... and they each have their own jobs to do
Concentrate on price action. Today after the market closes get a sheet of paper and label each 5min time frame. 9:30, 9:35, 9:40 in each of these price action time zones write HH if market made a highier hi or LL if market made a lower lo. and also count L1 L2 L3 a highier hi will stop the count and it will become a L1 once another lower low is made. at times of highier time frame rollover from going up to rolling over you will see lots of false breakouts. During periods of balance like from todays lows forward you get better follow through....i.e. buying H2,s selling those longs at H4,s and buying L2s if your bullish. Do this and you can trade any market any time frame. And dosnt matter which numbers the market chose to pause, pull back or whatever. just my opion do this and you can feel in you hand market shifts and follow through. Caution though ES will most of the time do a false breakout in the direction of the rth trend after a pullback. about 10:30a.m. est
you will find that over time these "Lines"......get retested about 85% of the time and the trick is to use some line area to trade for another.....this concept is really no different then the concept I mentioned a few years back when I said that single prints/lvn's and POC/Vpoc that get blown through have a very high probability of being retested....now obviously the billion dollar question is "From where or what other point will the retest take place.....?" Today is a great example of all that.....I would advise anyone interested to print out the HTN's and LTN's from 2-20 and see how they played the lines......the ones that worked and perhaps even more important would be the ones that got " blown through" as if the area wasn't there and then got retested later
It is less likely for the market to trend in the morning so that is my focus as most know.........The more energy and time that builds up as a day wears on then the greater the odds of seeing some line from a previous day get blown through and NOT get retested the same day....keep that in mind if u r obsessed like I use to be and are watching the markets too much and after the key 90 minute window( ok, perhaps it's only a key to me)
using just classic market profile you would have seen single prints at 94.75 and a POC at 93 without using the time histogram as I do to correlate areas......both blown through and then retested
and for those who follow the bands - The WEEKLY 1/2 SD band based on 7 days came in at 2085.75 !!
good to see ya here and I agree ..don't be afraid......many small losses and then a good win can make your day........!!
Originally posted by radyk
try to take the quick loss than miss the move. Very frustrating.
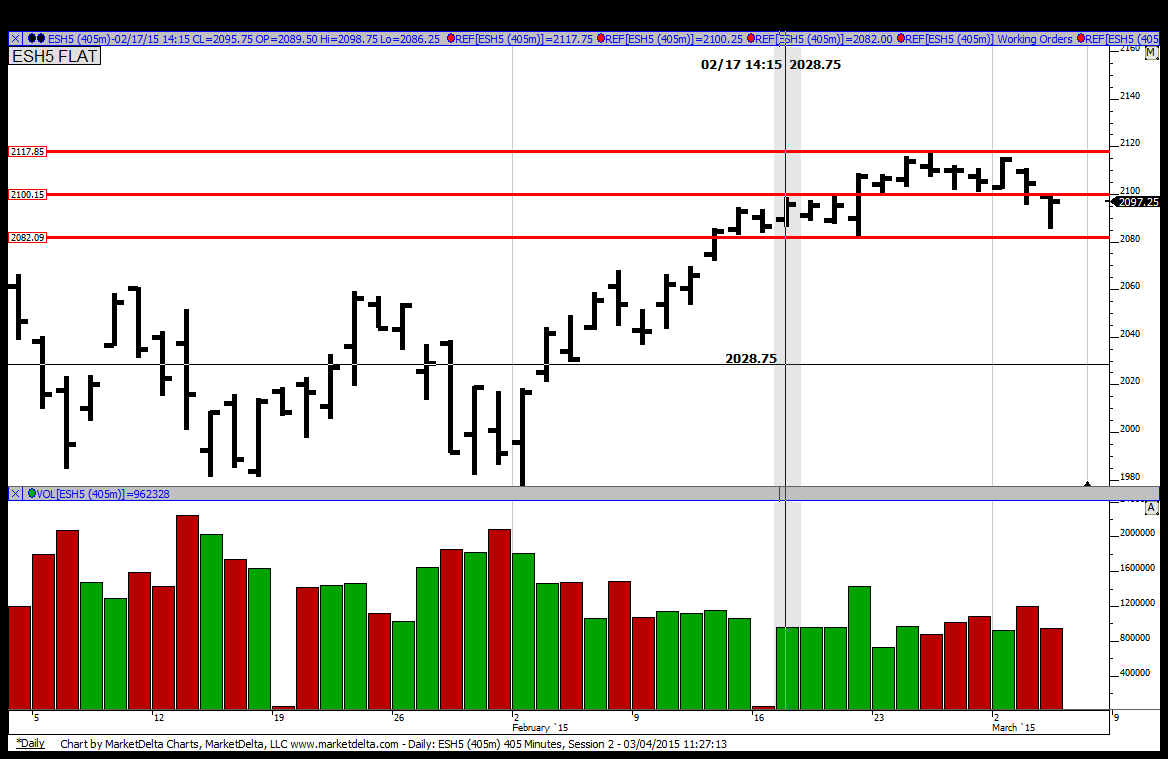
Look at the picture below. It is a daily bar chart. My thinking last night was to be focused on the middle line. YD we broke through it but failed to close below it and ended up back in the range between the top and middle lines. Today we opened below the middle line, tried very briefly to get above it, went below and triggered all the stops that Joe mentioned. This was another classic setup that simply had to be taken as this was a falling out of balance trade, which usually does a massive stop run. As Bruce mentioned, then 2/20 (the last big up bar that brought us into this upper range) came into play and we could look at it's HTN and LTN nodes for a stopping place. And to boot, I had a greenie at 85 too so that was really a logical place for the market to stop if they were just doing a stop run and not new sellers coming in.
All this makes sense. Just need to see it in real time as it unfolds. I need to do a better job preparing for the day and come in with all these scenarios thought out and planned for.
Joe, thanks for your suggestion. I will go back and do that study tonight after the market closes.
All this makes sense. Just need to see it in real time as it unfolds. I need to do a better job preparing for the day and come in with all these scenarios thought out and planned for.
Joe, thanks for your suggestion. I will go back and do that study tonight after the market closes.
Click image for original size
Thanks for sharing that CharterJoe!!!
Just to add more grist to the mill. Today is the type of day that made me change from a fader to a momentum trader. I try to let the market tell me a story (price action).
Earlier I mentioned the EURO IB low as critical. it was critical because once it was broken to the downside, there was very little push to go above it, price just consolidated sideways around and below the Euro low.
This had me leaning short all the way. When the little burp on the opening didn't hold it was time to hop on short. Targets- Y low and beyond on runners.
Different perspective.
Good luck to all.
Bravo...that is awesome you caught that move down....I have EU IB low at 99.25..guessing yours was near there?
Time wise you are looking for 3-4am EST to give you your range?
Time wise you are looking for 3-4am EST to give you your range?
Originally posted by Big Mike
Just to add more grist to the mill. Today is the type of day that made me change from a fader to a momentum trader. I try to let the market tell me a story (price action).
Earlier I mentioned the EURO IB low as critical. it was critical because once it was broken to the downside, there was very little push to go above it, price just consolidated sideways around and below the Euro low.
This had me leaning short all the way. When the little burp on the opening didn't hold it was time to hop on short. Targets- Y low and beyond on runners.
Different perspective.
Good luck to all.
that is precisely what i am trying to do as well... be a momentum trader when the opportunity presents itself and the rest of the time be a fader..... good trading Big Mike.
Originally posted by Big Mike
Just to add more grist to the mill. Today is the type of day that made me change from a fader to a momentum trader. I try to let the market tell me a story (price action).
Earlier I mentioned the EURO IB low as critical. it was critical because once it was broken to the downside, there was very little push to go above it, price just consolidated sideways around and below the Euro low.
This had me leaning short all the way. When the little burp on the opening didn't hold it was time to hop on short. Targets- Y low and beyond on runners.
Different perspective.
Good luck to all.
Emini Day Trading /
Daily Notes /
Forecast /
Economic Events /
Search /
Terms and Conditions /
Disclaimer /
Books /
Online Books /
Site Map /
Contact /
Privacy Policy /
Links /
About /
Day Trading Forum /
Investment Calculators /
Pivot Point Calculator /
Market Profile Generator /
Fibonacci Calculator /
Mailing List /
Advertise Here /
Articles /
Financial Terms /
Brokers /
Software /
Holidays /
Stock Split Calendar /
Mortgage Calculator /
Donate
Copyright © 2004-2023, MyPivots. All rights reserved.
Copyright © 2004-2023, MyPivots. All rights reserved.