Price bar overlap
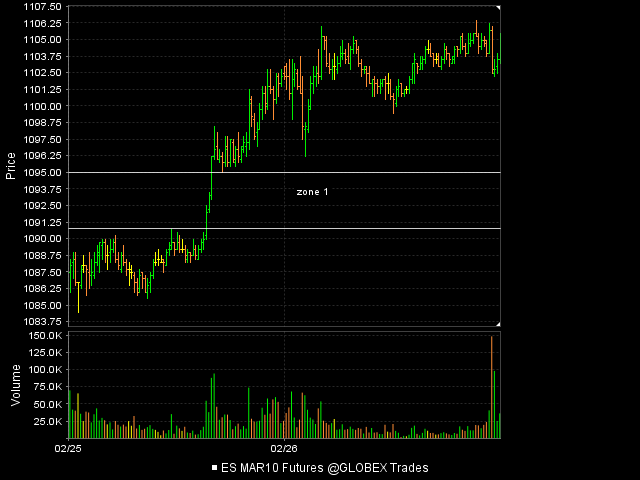
I'm planning to explain this more soon but this is a start. Notice how we have what I call an "air pocket" in between the high of the first green bar from the left and the low of the last green bar on the right.
These are 5 minute bars and I will include the context chart
This thread will attempt to expand on the concept of "mini singles" that we have covered before from the one minute chart. I have snapped a horizontal line to represent this "Pocket"
These are 5 minute bars and I will include the context chart
This thread will attempt to expand on the concept of "mini singles" that we have covered before from the one minute chart. I have snapped a horizontal line to represent this "Pocket"
Click image for original size
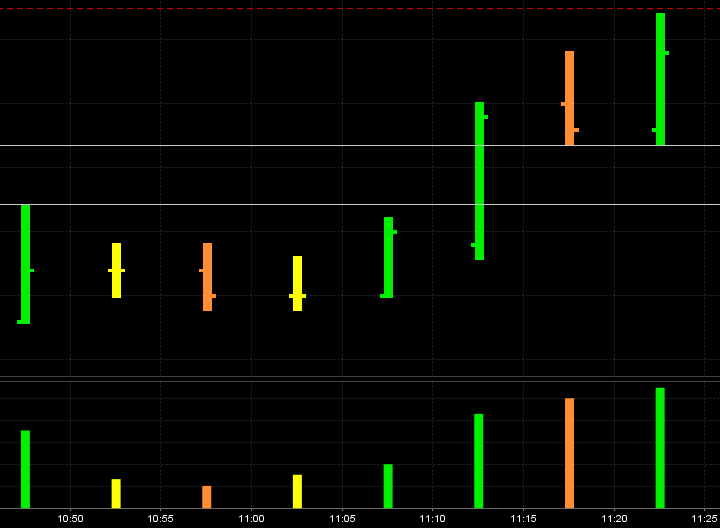
Not much time spent at 98.75 but the real air pocket begins down at 1095
Originally posted by BruceM
Thanks for the input Gio. I use the close above or below as a filter so do you know off hand if it can do that ? It isn't really the size of the bars but where we close in relation to the current highs or lows of the session...obviously the further away from those highs or lows that we close then the more "air" we create. We could have a big push to new highs on the day with a big bar but still close below the previous high so no air would be created...Originally posted by gio5959
bruce - ensign has a script for that and its called large range and small range bars - and its free if you subcribe to their software - ive been using it for a long time now
take care
hello bruce
i dont know the formula but im sure it wouldnt be too difficult to figure out
here is a pic of a 5min chart of the ES from yest showing ensign's large range candles in blue (i drew some red arrows to them) - price came back to fill two of them - there is one unfilled at 1091.25
gio
Click image for original size
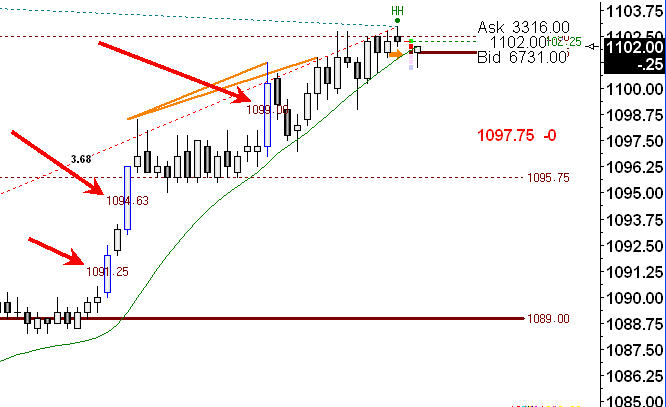
Thanks for taking the time with that Gio...it seems like a good concept although a bit different from what I watch.....so far today the concept of air has picked off the top and bottom within one bar..now I'd be real impressed if they can roll it over to go for that huge zone below 95....
we can see the reversal bar after the air formed on the lows and the inside bar after the air formed on the highs..just pointing those out for reference..not looking to make this thread about personal entries and will try to keep it to the concepts from here.
we can see the reversal bar after the air formed on the lows and the inside bar after the air formed on the highs..just pointing those out for reference..not looking to make this thread about personal entries and will try to keep it to the concepts from here.
Click image for original size
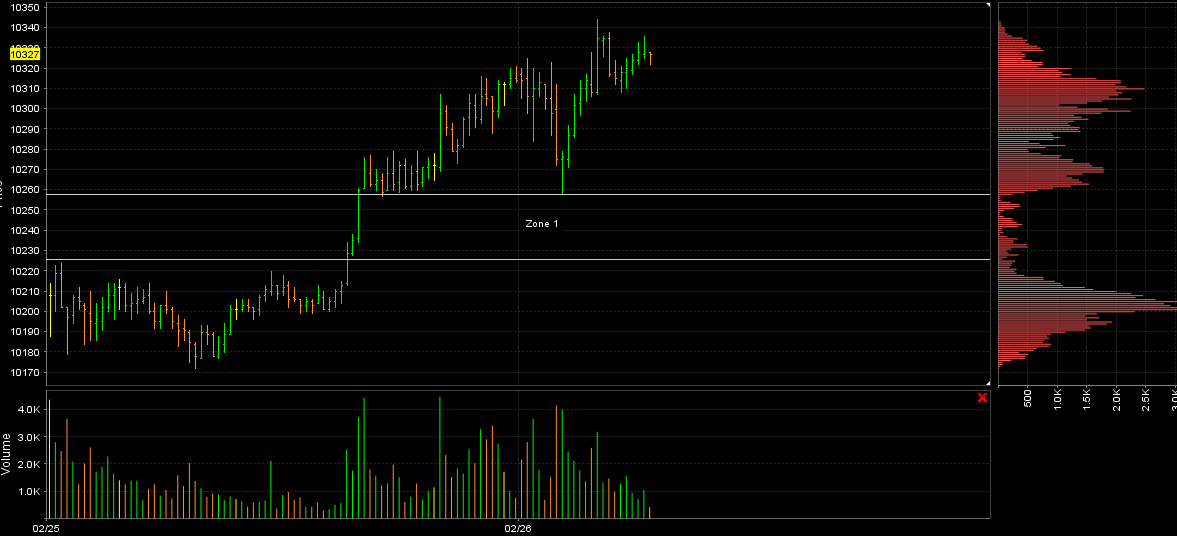
These should be good to round out these ideas...here is a chart of Thursday and Friday on the YM......notice the dip on Friday into Zone 1 , this is the air pocket created on Thursday.....and the YM hit the pockets high....the second chart is the ES and note how we don't quite get down into the Zone 1 high...which denotes strength in the ES.
I think we will fill in the air pockets with Monday or Tuesdays trade. If an air pocket holds and we rally from it like the Zone 1 test then I'd like to see a trend day unfold but in this case we just consolidated with out going too far above Thursdays highs.
This current trading price up at the 1110 in the current overnight has air pockets below so shorts are at hand.
The YM chart first
And here is the ES
I think we will fill in the air pockets with Monday or Tuesdays trade. If an air pocket holds and we rally from it like the Zone 1 test then I'd like to see a trend day unfold but in this case we just consolidated with out going too far above Thursdays highs.
This current trading price up at the 1110 in the current overnight has air pockets below so shorts are at hand.
The YM chart first
Click image for original size
And here is the ES
Click image for original size
Air theory works wonder Bruce......
08:41:09 1 SELL_LIMIT 1109.50
09:00:00 1 BUY_LIMIT 1108.00
08:41:09 1 SELL_LIMIT 1109.50
09:00:00 1 BUY_LIMIT 1108.00
Here is another good scalp though I expect it to retrace to 1104
09:17:39 1 SELL_LIMIT 1112.25
09:22:46 1 BUY_LIMIT 1111.00
09:17:39 1 SELL_LIMIT 1112.25
09:22:46 1 BUY_LIMIT 1111.00
BRUCEM, your 2/26 post included
"Thanks for taking the time with that Gio...it seems like a good concept although a bit different from what I watch.....so far today the concept of air has picked off the top and bottom within one bar..now I'd be real impressed if they can roll it over to go for that huge zone below 95...."
if you look at a 24hour chart for that day, the WRB to the upside that created your desire to see Px go for that huge zone below 95..."
that "air-up bar was actually a "filling" of the air created by the pre-open drop. very apparent on 24hour chart.
make sense?
also, one thing I have noticed, when there is air, (for this example we'll say AIR-UP), if it is retested and sellers cannot force price lower; if sellers are unable to singnficantly undrcut the H of the air-up bar, then buyers are in control and we have the confidence boosting military condition known as "air support!"
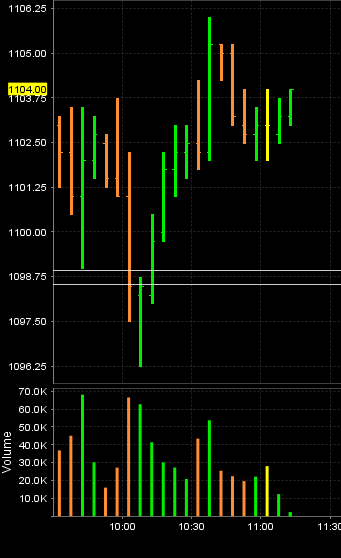
Good insight Paul and I like your terminology. Here is how fridays session reacted off the "air" generated from Thursdays trade. I beleive Fridays low is a bad low meaning that that price should get tested very soon. There just wasn't any impulse. We can see the difference in the way the bars form and the volume. Compare the attempted retest of the 95 area ( Zone one) earlier in this thread....the zone holds and we move away fairly quickly. There where no triples that formed like Fridays lows....just no rush to get long for anyone.
Click image for original size

air filled on MOnday.
BruceM, can you offer some sort of a description of the PA on Friday that made you expect undercut of Friday's L?
BruceM, can you offer some sort of a description of the PA on Friday that made you expect undercut of Friday's L?
Paul,
We had left over "triples" from thursday and we where holding below a key number of 1150. Then we have another low range day. If we had a good rally the range would have expanded. Compare Fridays air pocket test to the one we did into the 995 area?
Agressive on shorts now over 1152. We have an air pocket....but we need to be careful as we are now ABOVE the 1150 and we are outside the first hour. so many expecting the sell off so I'm not convinced yet. Leftover triples from Mondays trade down into 1143 - 1144 and a gap.....they will clean it up but the key question is WHEN will they do it?
Originally posted by PAUL9
BruceM,
Are you a head honcho?
Have to guess You are a head honcho.
I Need to find instructions for starting a thread.
I sifted through FAQ and found nothing. can you direct?
I sent you a PM with more info but basically it says click the "New Topic" link at the top of this page to create a new "thread". It's a bit confusing as threads are called topics on this forum.
Emini Day Trading /
Daily Notes /
Forecast /
Economic Events /
Search /
Terms and Conditions /
Disclaimer /
Books /
Online Books /
Site Map /
Contact /
Privacy Policy /
Links /
About /
Day Trading Forum /
Investment Calculators /
Pivot Point Calculator /
Market Profile Generator /
Fibonacci Calculator /
Mailing List /
Advertise Here /
Articles /
Financial Terms /
Brokers /
Software /
Holidays /
Stock Split Calendar /
Mortgage Calculator /
Donate
Copyright © 2004-2023, MyPivots. All rights reserved.
Copyright © 2004-2023, MyPivots. All rights reserved.