Price bar overlap
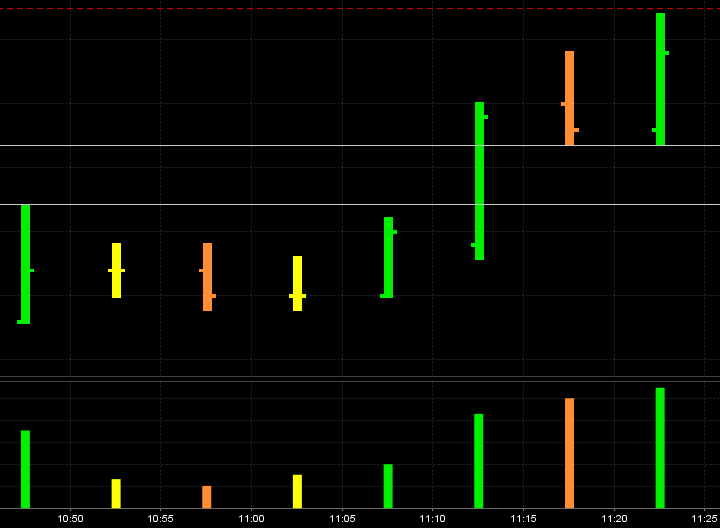
I'm planning to explain this more soon but this is a start. Notice how we have what I call an "air pocket" in between the high of the first green bar from the left and the low of the last green bar on the right.
These are 5 minute bars and I will include the context chart
This thread will attempt to expand on the concept of "mini singles" that we have covered before from the one minute chart. I have snapped a horizontal line to represent this "Pocket"
These are 5 minute bars and I will include the context chart
This thread will attempt to expand on the concept of "mini singles" that we have covered before from the one minute chart. I have snapped a horizontal line to represent this "Pocket"
Click image for original size
In the context of this thread Paul the only real target initially should be a retest and filling in of the air pocket. You are correct in assuming that the triples would be the next logical target for me and then the opening range area if I still had runners. This thread here adds a little more perspective even though it is brief.
http://www.mypivots.com/Board/Topic/5189/1/volume-attractors
The best air pockets will form from a volume thrust and that is the breakout. You can probably tell by now that most breakouts either fail or get tested. There is no magic in the 5 minute bars and I beleive it is the markets ability to go test volume as an attractor that really helps these air pockets get filled in. If you look at a one minute chart from yesterday you can see that up until about 1:30 est the highest one minute thrust was on the open bar ( first minute of trade). So it was no surprise that it's high got tested at 10:30. The parabolic move you mention created a higher volume thrust which pegged the high of the day. Look at that retest that created a 1-2-3 pattern at the highs. That high is now critical and hopefully the test is complete and we get the selloff today. Also 61 had big spikes and we close there so that will be critical today. These ranges are tight so the key volume numbers are tight too. Unfortunately..
I find that a great way to enter a fade for a long breakout failure is when we trade above the 5 minute bar that creates the air pocket. Sometimes we need to add on at the second close of a breakout. Yesterday I was hoping to get add ons for my short at the plus 8 number but it didn't hit again ( see the pitbull thread) so I incorporate other ideas knowing that the air pockets are there below me to target. That is the real key. That is why I'm a fader. Some may prefer to just enter the trade and use a function of the average ranges as a stop loss. So much about entries, exits and stops depends on account size and risk tolerance so I shy away these days from telling someone exactly how THEY should trade.
This diminished volatility brings smaller air pockets but the concept was most important for me to get across in this thread. When they really break it out then the trend traders win and we lose. It's really that simple. Hope that helps.
Bruce
Originally posted by PAUL9
BruceM,
when you get a chance. ES just had a parabolic intraday move up near 1:30 ET, it created air. Is there some sort of pattern that you look for to put on a counter trade (a sell in this case), I also see that there were TRIPS (Lows) AT 61.75, is that target?
I have to found time to read all the different links.
thank you for taking the time to present that explanation.
so, really, part of a fade pattern after a 5m thrust can be a 1-2-3 in the 1 minute.
thanks
so, really, part of a fade pattern after a 5m thrust can be a 1-2-3 in the 1 minute.
thanks
BTW,
Brooks, expresses same observation about the breakouts (most fail), and I would like to add (I can't remember whether he wrote this or not), but when you see H&S taking shape, watch for failure because that can trap alot of players, forcing them to fuel the failure move.
Most breakouts fail (and your comments about retest etc)...
now I have a confession to make... Bless me market, for I have sinned: years ago, I was an expert at going Long near the H of a breakout and going short near the low of a breakout to the downside. many times, I was able to establish positions long at EXACTLY the High tick and short at EXACTLY the LOW tick, so I am a believer in the fades as you have described.
It is impressive to see a chart with a successful breakout, but if you look at the chart, you can find far more times when price poked its head above recent resistance and then came back to earth.
Done! New link:
http://www.mypivots.com/Board/Topic/4558/1/es-trading-probabilities
but old link will still work as well.
http://www.mypivots.com/Board/Topic/4558/1/es-trading-probabilities
but old link will still work as well.
Originally posted by BruceM
How about ES Trading Probabilities ? I was hoping that others would contribute to the thread and having my name on it may hold some back from contributingOriginally posted by day trading
Originally posted by BruceM
here is another key for me Paul...found in Bruce's probabilities thread.....a terrible thread name and if I could find Joe I'd ask him to change it..
http://www.mypivots.com/Board/Topic/4558/1/bruces-probabilities
This helps keep it in context and additional targets when our runners get lucky..
What do you want it changed to?
a shot of the entry if one wishes...you go long on the break of bar threes ( labelled 3 )low to target the air pocket
Click image for original size
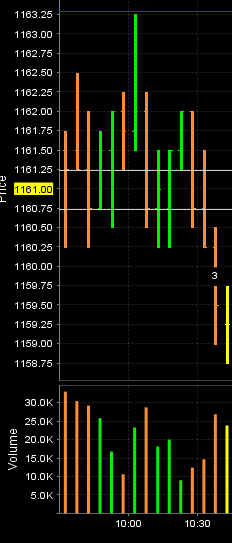
"3" noted in chart, is that just 3rd LL bar?
Also,
do you use any qualifier for the expected rebound. You said L of 3rd, but in a down leg, pause can create a High higher than the L of a bar like bar3, but then price can just continue lower.
do you ever wait for the pause bar to complete, and then be willing to enter on a breakout in the direction of expectation? (breakout of that that pause bar's range?)
That 5m bar that completed at 2:35pm, that was air, wasn't it?
Tomorrow (if nothing breaks between now (3:00pm Thurs) and then... stay tuned for the breakout of the ES Corral.
Corral located between 1165.50 and 1155 on ES street. FIrst tests of the fences should be short-term intraday rejections, but if the herd starts a stampede, fences will be broken on second run.
Hope I didn't upset anybody?
welp, the open today (Friday triple witch) was right near the 1165.50, and price was rejected immediately.
Noticed unfilled air from the RTH on Wednesday that has now been filled.
welp, the open today (Friday triple witch) was right near the 1165.50, and price was rejected immediately.
Noticed unfilled air from the RTH on Wednesday that has now been filled.
BruceM,
could you please look at chart from Thursday 3/18/10.
specifically coming up off the bottom just after 1:00 EDT.
are those 2 bars technically AIR?
could you please look at chart from Thursday 3/18/10.
specifically coming up off the bottom just after 1:00 EDT.
are those 2 bars technically AIR?
When dealing with the 5 minute air pockets they can only be created when we get a 5 minute close above or below all other price action for the day in the RTH. IN other words new closing highs or lows on the 5 minute data. Any other time we will not be making new ground on the day so we will be overlapping with prices that have traded earlier in the session....
The one minute thrusts can help filter the good and bad trades...we are looking for inefficencies to correct themselves...more later
The one minute thrusts can help filter the good and bad trades...we are looking for inefficencies to correct themselves...more later
I understand (I re-read the thread, every single word and saw your reference to new session H or L).
I appreciate any and all observtions you have.
Now off to read Trips
I appreciate any and all observtions you have.
Now off to read Trips
Originally posted by PAUL9
BruceM,
Are you a head honcho?
Have to guess You are a head honcho.
I Need to find instructions for starting a thread.
I sifted through FAQ and found nothing. can you direct?
I sent you a PM with more info but basically it says click the "New Topic" link at the top of this page to create a new "thread". It's a bit confusing as threads are called topics on this forum.
Emini Day Trading /
Daily Notes /
Forecast /
Economic Events /
Search /
Terms and Conditions /
Disclaimer /
Books /
Online Books /
Site Map /
Contact /
Privacy Policy /
Links /
About /
Day Trading Forum /
Investment Calculators /
Pivot Point Calculator /
Market Profile Generator /
Fibonacci Calculator /
Mailing List /
Advertise Here /
Articles /
Financial Terms /
Brokers /
Software /
Holidays /
Stock Split Calendar /
Mortgage Calculator /
Donate
Copyright © 2004-2023, MyPivots. All rights reserved.
Copyright © 2004-2023, MyPivots. All rights reserved.