Price bar overlap
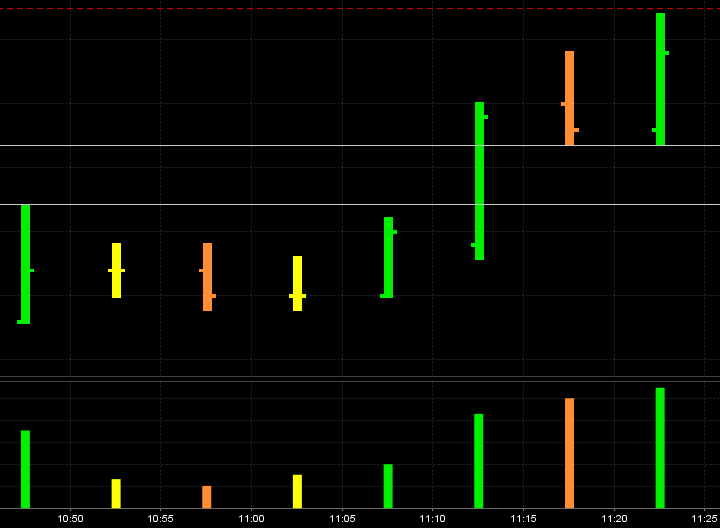
I'm planning to explain this more soon but this is a start. Notice how we have what I call an "air pocket" in between the high of the first green bar from the left and the low of the last green bar on the right.
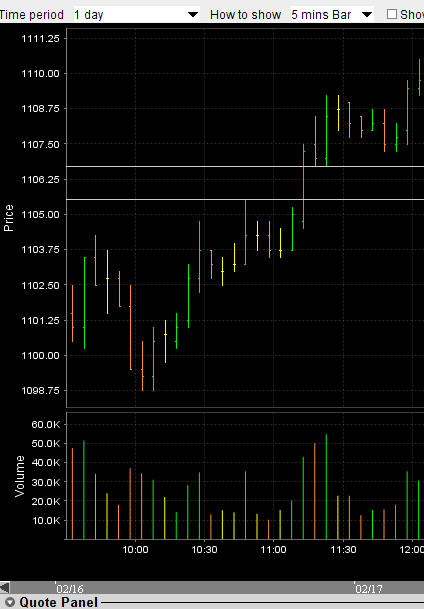
These are 5 minute bars and I will include the context chart
This thread will attempt to expand on the concept of "mini singles" that we have covered before from the one minute chart. I have snapped a horizontal line to represent this "Pocket"
These are 5 minute bars and I will include the context chart
This thread will attempt to expand on the concept of "mini singles" that we have covered before from the one minute chart. I have snapped a horizontal line to represent this "Pocket"
Click image for original size
Thanks Bruce, looking forward to learning the concept
Here is the ES from friday up until about noon with the snapped line. Note the increase in volume on the breakout that formed the "air pocket". What I'm trying to demonstrate with this thread is the efficiency of the emini and the consolidating properties it offers.
Click image for original size
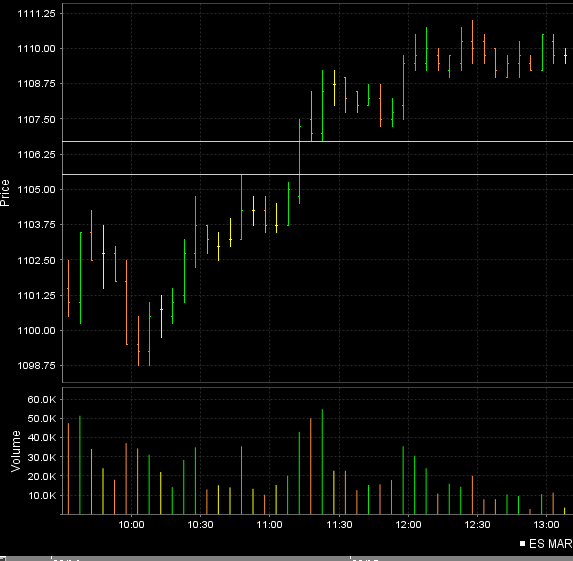
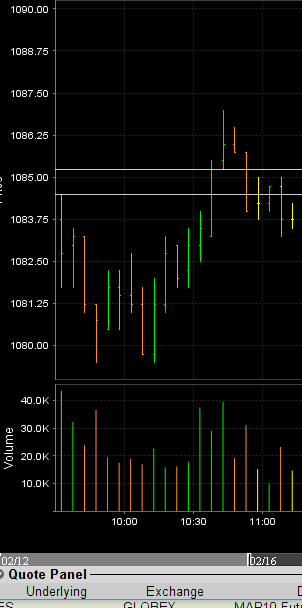
here we are moving forward now...note the triple at 1109 and the air pocket that sits below....both good reasons to try for the short as per the chart of the day posting.....
Click image for original size
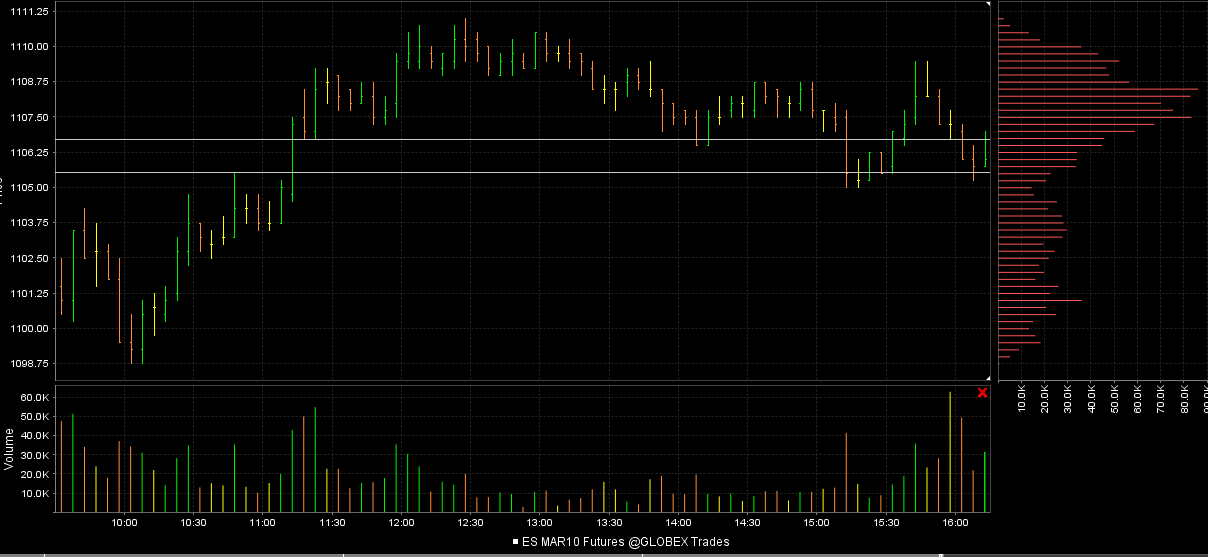
here is the entire day..note the low volume at 12:30 that starts to form the triple but more important to this thread is that air pocket...note the bounce off it and the filling in of the air pocket.....
Every single time they created air on the 5 minute it was eventually filled in. This is not uncommon. The real trick is to be careful when they really do trend it. They won't fill in that air and we can lose $$$$$. The concept is critical in my world of fading. For me this goes beyond the concept of single prints in the world of market profile.
Click image for original size
Every single time they created air on the 5 minute it was eventually filled in. This is not uncommon. The real trick is to be careful when they really do trend it. They won't fill in that air and we can lose $$$$$. The concept is critical in my world of fading. For me this goes beyond the concept of single prints in the world of market profile.
I was going to spend time posting a boat load of sucessful chart examples of "air" getting filled in but lets get right to a failure.We need to know how and when concepts fail to make it as faders. This is Thursdays trade.....note the same type of breakout and even triples....I've snapped a horizontal line to denote the air...a true failure for a daytader...
But now along comes friday morning and they fill in the air...
Click image for original size

But now along comes friday morning and they fill in the air...
Click image for original size
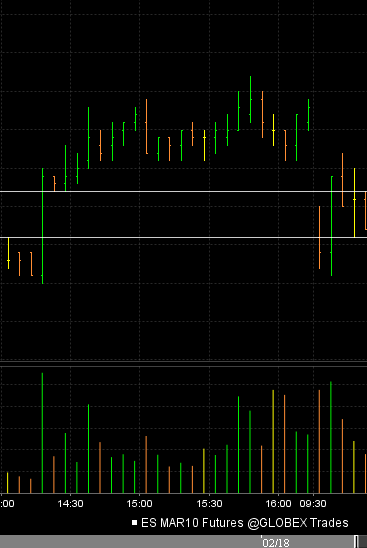
Most times the "air" is created and filled in fairly quickly due to the consolidating properties of the markets...sometimes you need to be quick.....this is from the 16th of February...the air is always created when we create new RTH highs or lows for the day and close outside of the previous highs or lows on the 5 minute bar time frame.
Look at that great inside bar which was a good clue that they might go fill in the air...
Look at that great inside bar which was a good clue that they might go fill in the air...
Click image for original size
the astute trader may want to refine this to see the precise point the "air" is created. Use a one minute chart and find the spot that has little price bar overlap. Another easy way is to use the Time at price study like you see in some of my charts and find that area that has the lowest histogram value. That is telling you that very little time was spent at that price
this isn't meant to be boastful but I believe that one of the reasons I am a better trader in the first 90 minutes or so of trade is because the market doesn't usually just open and begin trending. So it back and fills (consolidates) more often then a breakout that happens later in the day. Just an FYI !
Great insightful analysis that's fresh. Keep it coming on this subject, drilling down with what you see and how you view and interpret the market from this aspect! Good stuff!
Thanks Bruce - some great ideas there.
Originally posted by PAUL9
BruceM,
Are you a head honcho?
Have to guess You are a head honcho.
I Need to find instructions for starting a thread.
I sifted through FAQ and found nothing. can you direct?
I sent you a PM with more info but basically it says click the "New Topic" link at the top of this page to create a new "thread". It's a bit confusing as threads are called topics on this forum.
Emini Day Trading /
Daily Notes /
Forecast /
Economic Events /
Search /
Terms and Conditions /
Disclaimer /
Books /
Online Books /
Site Map /
Contact /
Privacy Policy /
Links /
About /
Day Trading Forum /
Investment Calculators /
Pivot Point Calculator /
Market Profile Generator /
Fibonacci Calculator /
Mailing List /
Advertise Here /
Articles /
Financial Terms /
Brokers /
Software /
Holidays /
Stock Split Calendar /
Mortgage Calculator /
Donate
Copyright © 2004-2023, MyPivots. All rights reserved.
Copyright © 2004-2023, MyPivots. All rights reserved.