Price bar overlap
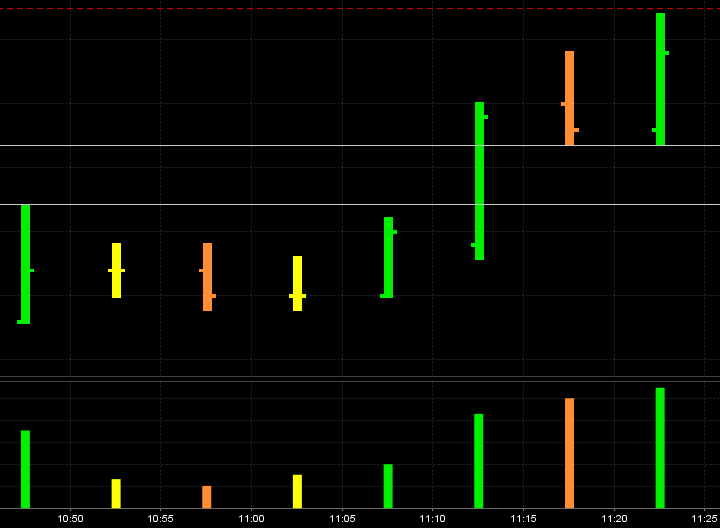
I'm planning to explain this more soon but this is a start. Notice how we have what I call an "air pocket" in between the high of the first green bar from the left and the low of the last green bar on the right.
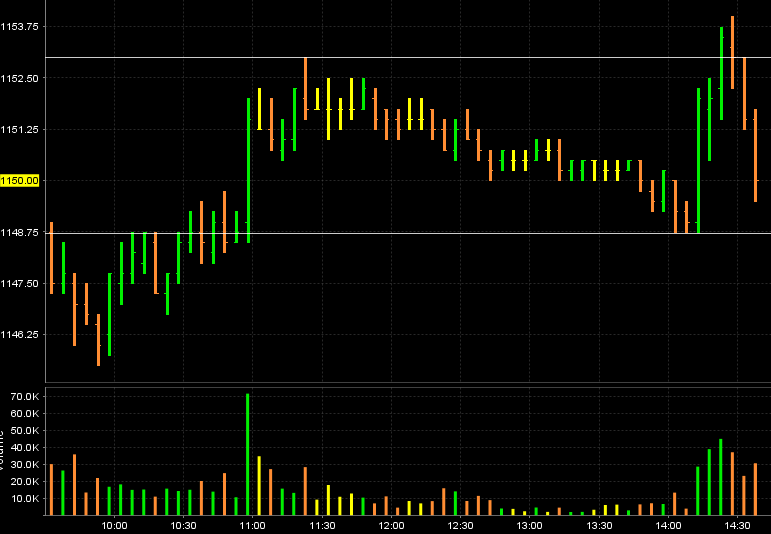
These are 5 minute bars and I will include the context chart
This thread will attempt to expand on the concept of "mini singles" that we have covered before from the one minute chart. I have snapped a horizontal line to represent this "Pocket"
These are 5 minute bars and I will include the context chart
This thread will attempt to expand on the concept of "mini singles" that we have covered before from the one minute chart. I have snapped a horizontal line to represent this "Pocket"
Click image for original size
This is a tough day: FOMC announcement day, and the recent history has seen most announcement days edging higher.
thanks for the description of PA.
thanks for the description of PA.
agree Paul.. but they should at least test the 50 number for us....it would be strange to just blow through so early without at least a test...
I'd stick a chart in if I knew How.
classic today. Historical positive bias due to announcement day and
on 5min chart, morning air at 11:00, filled just before the announcement.
I just wish I had a better handle about whether price coasts sideays for the rest of the day (or not).
day after announcement also has bias to reverse PA of announcement day so maybe the trips 42.50 get hit tomorrow.
a little tricky with expiration week, but quite often wednesdays of expirtion can open and trade one way, but reverse course later in the day.
look at that beautiful 5 minute new high close on the ES and YM can't even make new highs...now if we can just hold below 50 we are good to go for new daily lows today
here is the high close...horizontal is pre fed high....c'mon triples at 48.75 ..we all see them...
Click image for original size
Well they broke those triples and rallied it to new HIGHs...quite the opposite of what I thought.......S&P was trying to lead the Naz and YM but I'm unimpressed...with an open of 1148.75 they couldn't even get a plus 8 number in the RTH at 1156.75 on a fed day...yikes...not a great situation for those of us who depend on volatility and the moves to earn a living...
Big closing divergence in YM and ES has me thinking that we really need a way to get short up here..lots of good targets on the downside..
The practical point of this post is to remind folks ( and myself)of the relationship between the YM and ES markets...On Monday the YM was testing it's breakout point in thge 510 - 520 area from last Thursday..that breakout held and we went on to make highs above last weeks highs....
What I find strange is that the market is defying all bearish indications. Last time I saw this happen we saw 666.
ak1,
what exactly are the bearish indications you are referring to?
are you a swing trader or intraday?
what exactly are the bearish indications you are referring to?
are you a swing trader or intraday?
BruceM,
why did you expect additional downside near 49? (I am not up to speed about the patterns you trade. I have come into this forum because I group I used to participate has been poluted by people who are not sharing, and are even posting statistics that are figments of their imagination..."
I watch OR15, and the H of the OR15 was exactly 49.00. Usually, when price gets above this level, a return to it is a search for support. and it must be viewed as support unless price undercuts by something more than like 3 points.
well, at least the first test is usually worth a bounce (which it was), but it still remains a viable support level until decisively broken (which can be a little painful).
just wondering.
I am still expecting downside tomorrow to be an intraday bounce point (but would have to see HH HL on 5m.
a test of 44-42.50 would be natural.
Hi Paul and welcome to the forum. It's not as active here as it use to be but it's a good group of folks. I'm a fadar so most of my trades seem opposite of many price action trend setups. The ideas I use can be found under the strategies and setups tabs....let me know if you have trouble finding them...these are my main ideas I trade from...
The pitbull one, two and three
Running the triples
Price bar overlap
Most of my trades begin with a target first under the theory that we trend less than 20% of the time so why trade as if we are trending?
I also am very familiar with Market Profile so I lean on those ideas too...I trade better in the first 90 minutes due to my fading nature...
The 15 is a good Opening range to use...lots of the crabel players will lean on that......let me know more of your style when you have time
Originally posted by PAUL9
BruceM,
Are you a head honcho?
Have to guess You are a head honcho.
I Need to find instructions for starting a thread.
I sifted through FAQ and found nothing. can you direct?
I sent you a PM with more info but basically it says click the "New Topic" link at the top of this page to create a new "thread". It's a bit confusing as threads are called topics on this forum.
Emini Day Trading /
Daily Notes /
Forecast /
Economic Events /
Search /
Terms and Conditions /
Disclaimer /
Books /
Online Books /
Site Map /
Contact /
Privacy Policy /
Links /
About /
Day Trading Forum /
Investment Calculators /
Pivot Point Calculator /
Market Profile Generator /
Fibonacci Calculator /
Mailing List /
Advertise Here /
Articles /
Financial Terms /
Brokers /
Software /
Holidays /
Stock Split Calendar /
Mortgage Calculator /
Donate
Copyright © 2004-2023, MyPivots. All rights reserved.
Copyright © 2004-2023, MyPivots. All rights reserved.