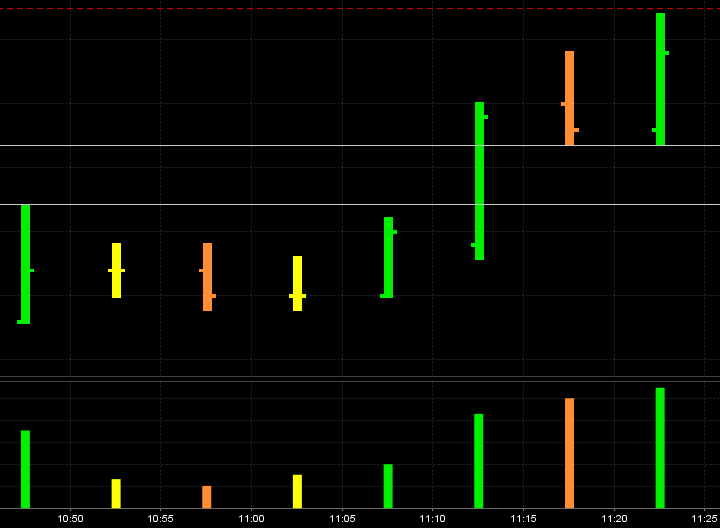
Price bar overlap
I'm planning to explain this more soon but this is a start. Notice how we have what I call an "air pocket" in between the high of the first green bar from the left and the low of the last green bar on the right.
These are 5 minute bars and I will include the context chart
This thread will attempt to expand on the concept of "mini singles" that we have covered before from the one minute chart. I have snapped a horizontal line to represent this "Pocket"
These are 5 minute bars and I will include the context chart
This thread will attempt to expand on the concept of "mini singles" that we have covered before from the one minute chart. I have snapped a horizontal line to represent this "Pocket"
Click image for original size
if this forum were more active, I would post more often.
PA today was a volatility fan. A persisitent search for stops as price exceeded swing lows and swing Highs by just a tick or two. (Often 5 swings, sometimes 7 swings, but the tell-tale that it's over is a swing toward an extreme that has trouble at 50% of the swing H to swing L.
Volitility fans are pretty rare, but it jumped off the chart today (look at 24 hour prices 5m works well. From 4am to 11 am there was only 1 swing that did not establish a new H or L).
When there is a volitility fan, PA should be viewed as bizarre (channel type) consolidation.
When there is a swing that does NOT go to a new Low or to a new High in the series for the fan, expect a measured move.
When should you be aware that a measured move might occur?
In a regular consolidation of a channel, there are Highs and lows (a volitility fan produces HH and LL) but it is still subject to the regular rules of a consolidation band: that being: when a new H or new L for the fan has been established, BUT... price does not swing to the opposite boundary far enough to make a new swing H/L, (usually stops Half-way and turns, then consider calculating a measured move: take the most recent swing range and add it to the swing H/L (depends on whether the failure to establish a new H/L is a swing down from a H or up from a L).
Today,
at 12:40 was the first attempt to swing to a new volatility fan Low... THAT attempt for a new Low FAILED.
Then again at 2:00- 2:05 was another failure to swing to a new low... HEY, that's a double bottom (Intraday double bottom), but with voalitility fan in place, take the range of the fan, add to the low of the failure swing.
Today, failure was from H to L. AT 12:40 range swing H to L was 1164.50 to 1159.00, 5.50 points,
and at 2:00pm, there was a double bottom (intraday), that was a failure to move to a new low... that swing H to L was 1165.25 to 1162.25, or 3.00 points, that's the min8imum target for a move above the established H. (this is just an A-B-C, A 1-2-3 measure move. two potential targets based on most recent H to L swings, one target was 4.75 added to established H, (69.50 based on H to L of 4.75 points (where L did Not establish a New L) added to the H, which was 1164.75 established at 5m bars con=cluding 12:15 and 12:20 pm).
second potential target was H at 1:30 of 1165.25 + 4.75 = 1170.00 The most imporatnat thing to recognize is that Price could not/ DID NOT swing to a new Low today, so that makes a move BACK ABOVE the established H a buy point.
If the recent swing H is broken (1165.25 or really, 1164.75, add the 4.75 to the breakout point, that would be either 1164.75 or 1165.25 Plus 4.75 and that equals 1169.50 or 1170,
pretty damn close to HOD (1170.50) (I employ 3 tick squash).
It's all so eay when the ink is dry on the chart, and I will tell you that I only stayed in for half for the breakout move (I blew it), but the principles of a channel that finally gives it up can and shoud be applied to a volaitlity fan.
... I have an appointment with Jack Daniels... Good Trading to all...
we can also add in the r1 level today which was 1168 and we know they try and push beyond 2.5 - 4 points to shake out the weak hands. We know that 70 - 75% of the time they will hit an R1 especially when they can't hit the pivot..like you said Paul..sometimes its easier to see it all after the day is done..
I sure wish more were involved here too...
I sure wish more were involved here too...
This seems to be the critical area in the overnight and we have the pivot and Value area high traders here too..so far a failed breakout yesterday afternoon...I don't think we will go too far above 70 today if the gap players come in...my preference is to the downside and would like to see them fail at closing the gap and rollover to take out the stops at the 62 area and then yesterdays lows..
This is just a long winded way of saying " no longs for me"
This is just a long winded way of saying " no longs for me"
Originally posted by BruceM
66 goes on my radar...that's the breakout point with volume off the one minute....you will notice that the late breakout trend much better
I need to revise my thinking.....if we can hold above the 1166 and the YM can hold it's key support at 788 - 792 and the Nq can hold the 54 - 55.50 area then longs will be the way to go for the gap fill..
The numbers mentioned are all the high volume breakout points....from Tuesday. We obviously don't want to get under those in the RTH session
The numbers mentioned are all the high volume breakout points....from Tuesday. We obviously don't want to get under those in the RTH session
any chance I could encourage you to put this in a seperate thread with some charts?......although relevant here I think it warrants it's own thread...good stuff and I'd like to see more examples..
Originally posted by PAUL9
if this forum were more active, I would post more often.
PA today was a volatility fan. A persisitent search for stops as price exceeded swing lows and swing Highs by just a tick or two. (Often 5 swings, sometimes 7 swings, but the tell-tale that it's over is a swing toward an extreme that has trouble at 50% of the swing H to swing L.
Volitility fans are pretty rare, but it jumped off the chart today (look at 24 hour prices 5m works well. From 4am to 11 am there was only 1 swing that did not establish a new H or L).
When there is a volitility fan, PA should be viewed as bizarre (channel type) consolidation.
When there is a swing that does NOT go to a new Low or to a new High in the series for the fan, expect a measured move.
When should you be aware that a measured move might occur?
In a regular consolidation of a channel, there are Highs and lows (a volitility fan produces HH and LL) but it is still subject to the regular rules of a consolidation band: that being: when a new H or new L for the fan has been established, BUT... price does not swing to the opposite boundary far enough to make a new swing H/L, (usually stops Half-way and turns, then consider calculating a measured move: take the most recent swing range and add it to the swing H/L (depends on whether the failure to establish a new H/L is a swing down from a H or up from a L).
Today,
at 12:40 was the first attempt to swing to a new volatility fan Low... THAT attempt for a new Low FAILED.
Then again at 2:00- 2:05 was another failure to swing to a new low... HEY, that's a double bottom (Intraday double bottom), but with voalitility fan in place, take the range of the fan, add to the low of the failure swing.
Today, failure was from H to L. AT 12:40 range swing H to L was 1164.50 to 1159.00, 5.50 points,
and at 2:00pm, there was a double bottom (intraday), that was a failure to move to a new low... that swing H to L was 1165.25 to 1162.25, or 3.00 points, that's the min8imum target for a move above the established H. (this is just an A-B-C, A 1-2-3 measure move. two potential targets based on most recent H to L swings, one target was 4.75 added to established H, (69.50 based on H to L of 4.75 points (where L did Not establish a New L) added to the H, which was 1164.75 established at 5m bars con=cluding 12:15 and 12:20 pm).
second potential target was H at 1:30 of 1165.25 + 4.75 = 1170.00 The most imporatnat thing to recognize is that Price could not/ DID NOT swing to a new Low today, so that makes a move BACK ABOVE the established H a buy point.
If the recent swing H is broken (1165.25 or really, 1164.75, add the 4.75 to the breakout point, that would be either 1164.75 or 1165.25 Plus 4.75 and that equals 1169.50 or 1170,
pretty damn close to HOD (1170.50) (I employ 3 tick squash).
It's all so eay when the ink is dry on the chart, and I will tell you that I only stayed in for half for the breakout move (I blew it), but the principles of a channel that finally gives it up can and shoud be applied to a volaitlity fan.
... I have an appointment with Jack Daniels... Good Trading to all...
if we can get the YM to break down more we will have all markets below their key breakout numbers...ES should go get the overnight low and then the 58 area...
what was nice about the overnight low it had S1 coming in at 1162 today and all those double bottom stops from yesterday.....If it's too obvious then they usually will get ya!
Here is the breakout point in the YM from yesterday which became the new breakdown point from today I mentioned above..The YM was holding this up this morning...
Here is the breakout point in the YM from yesterday which became the new breakdown point from today I mentioned above..The YM was holding this up this morning...
Click image for original size

I guess I shouldn't have rambled on like that.
I just wanted to explain what I saw... that many waves (swinging to new Hs and new Ls by only a couple of ticks), its just not that common, that's why I mentioned it (also IMHO, it is easier to see the attempt to move to the other side of the fan that does NOT make it when there are so many swings as opposed to spmething like a 3 wave searches for stops -- they often don't have a "half way" slide or lift that fails.
I will consider a thread but over the next few days let me pay more attention to the shorter # of waves to see whether price is offering a recurring theme.
I won't be around today, have errands to run, good trading to all.
and thanks for your posts BruceM, good stuff.
The breakout point in the overnight is 1166.....trading to retest it..chart later
I posted on the wrong thread before...was short into the key 75....here is how my chart looked into the key 75 number....double line are the breakout points...with any luck runners will go to the 66 area....as usual it will be a tough hold
Click image for original size

Originally posted by PAUL9
BruceM,
Are you a head honcho?
Have to guess You are a head honcho.
I Need to find instructions for starting a thread.
I sifted through FAQ and found nothing. can you direct?
I sent you a PM with more info but basically it says click the "New Topic" link at the top of this page to create a new "thread". It's a bit confusing as threads are called topics on this forum.
Emini Day Trading /
Daily Notes /
Forecast /
Economic Events /
Search /
Terms and Conditions /
Disclaimer /
Books /
Online Books /
Site Map /
Contact /
Privacy Policy /
Links /
About /
Day Trading Forum /
Investment Calculators /
Pivot Point Calculator /
Market Profile Generator /
Fibonacci Calculator /
Mailing List /
Advertise Here /
Articles /
Financial Terms /
Brokers /
Software /
Holidays /
Stock Split Calendar /
Mortgage Calculator /
Donate
Copyright © 2004-2023, MyPivots. All rights reserved.
Copyright © 2004-2023, MyPivots. All rights reserved.