ES short-term trading for 7-15-10
Bruce,
You were right again (what else is new)
I see 81 printed, but I don't remember why you expected it.
Today is looking pretty grim, especially with the seasonal weakness koolblue had in that average performances of trade days of the month.
It is before 11 o'clock and the ES has already undercut its 5 day average of the Low versus the Open which is at 1086.50 for today. A move like this often means trend sell day.
with 5 day average RTH range at 12, today's RTH H minus 12 = 79.75, have to watch PA there , with second air, return to 83.25 likely? Am I reading this right, Bruce?
It appears that 1086.75 might be a decent short zone...if they can push it up there before new lows first
I see 82+ printed, but that little B wave from 10:55am to 11:10 would have had me second guessing big time. I have to employ runners.
trader43, I wish I knew.
I have noticed that on days when sellers are aggressive and price undercuts 5 day average of L versuss Open before 11am, that price can sometimes move back up to 5 day average of L versus Open and then have a failure to exceed on first test.
5 day average of L versus Open is 1086.50,
Here's a coincidence for you :
1086.50 is also the last single print for the MP.
Click image for original size

Click image for original size
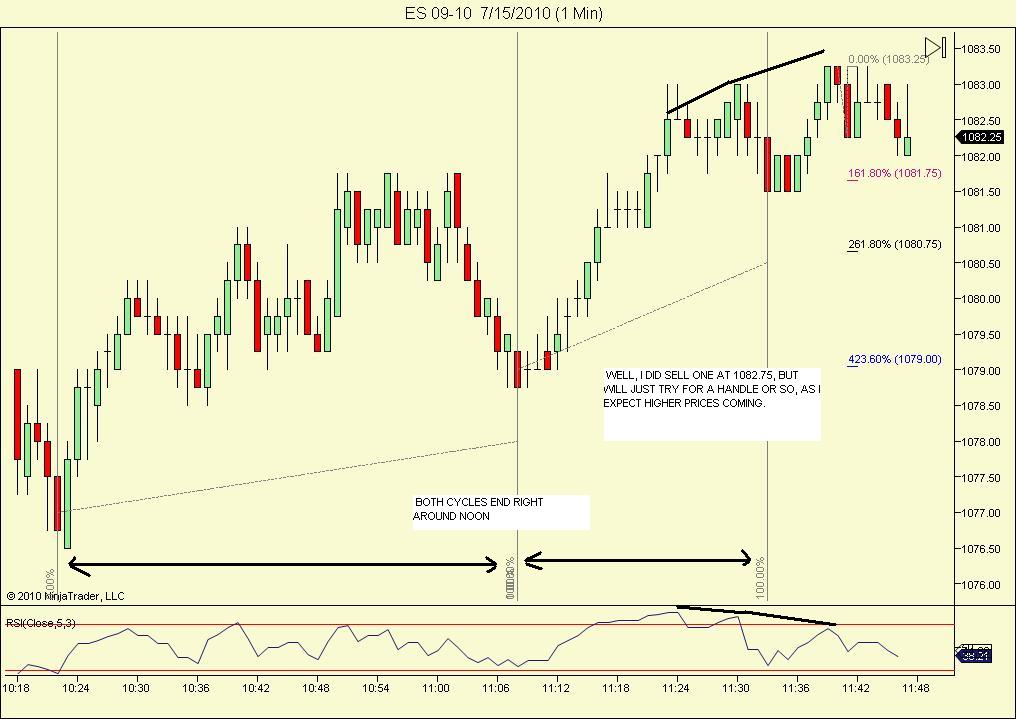
TRYING FOR 1081.00AS I HOPE 1080.50-1080.75 COULD BE HIT... but we'll just have to see...
Fib extension sample.
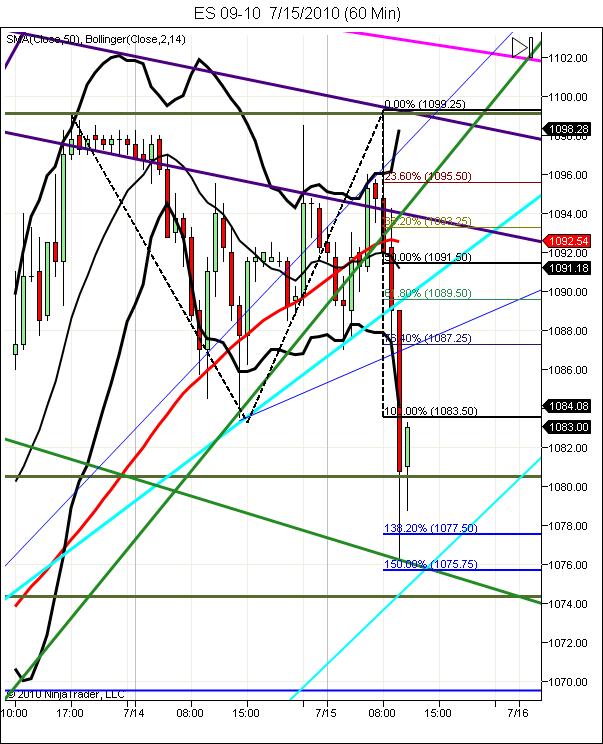
1st either hang out here waiting for further collapse(break that lower Cyan uptrend line.) Should at least touch off 1083.5 for that but not a law I know of.
2nd is wave 4 of 5 up?
Plenty of R to work through if so.
1st either hang out here waiting for further collapse(break that lower Cyan uptrend line.) Should at least touch off 1083.5 for that but not a law I know of.
2nd is wave 4 of 5 up?
Plenty of R to work through if so.
Click image for original size
Bingo!!! out both at 1081.00.. plus 1.75 on a somewhat risky short!
Somebody asked about indicators yesterday,...note that my short was in a very oversold market... but still worked! Thats why so many 'newbies. get crushed ,because indicators would have prevented them from taking a profitable short and had them going long!... Yes i use them, but mainly looking for divergencies ,or waning momentum..NOT for buy/sell signals
So to summarise todays scalps for me... resistance at 1086.75, 1088.50,1090.50 and support at 1074.75, 1068.50 and 1066.50.. Could alwys change, but thats what my charts are currently telling me. Looking off a little longer term... higher prices coming ,but weakness probable for a while first. Note that so far today, it looks as tho we are getting the early strength ,later weakness scenerio, and if that holds thru out the day ,would be short term bearish. also we appear to be getting daily range expansion on a down day ,also negative... just some thoughts FWIW..LOL
new shorts for me at 83.50......double 30 minute bar lows in 79 .25 ....seems like they are accepting the lower prices....so far!!
You can look here in the morning as it will be updated by then but we have had lots of high closing $Ticks this week...
http://www.wallstreetcourier.com/index1.htm
so doubt we have lots of divergence lately. This guy corey posts some simple but effective view points regarding internals too..
www.afraidtotrade.com
http://www.wallstreetcourier.com/index1.htm
so doubt we have lots of divergence lately. This guy corey posts some simple but effective view points regarding internals too..
www.afraidtotrade.com
Emini Day Trading /
Daily Notes /
Forecast /
Economic Events /
Search /
Terms and Conditions /
Disclaimer /
Books /
Online Books /
Site Map /
Contact /
Privacy Policy /
Links /
About /
Day Trading Forum /
Investment Calculators /
Pivot Point Calculator /
Market Profile Generator /
Fibonacci Calculator /
Mailing List /
Advertise Here /
Articles /
Financial Terms /
Brokers /
Software /
Holidays /
Stock Split Calendar /
Mortgage Calculator /
Donate
Copyright © 2004-2023, MyPivots. All rights reserved.
Copyright © 2004-2023, MyPivots. All rights reserved.