ES key levels on the downside
some levels as we go forward....downside only..wishful thinking perhaps as the world seems on bullish. Ranges are fairly small so zones are tight...not much room from level to level
1213.50 - 15.25 - VPOC and spike initiation point ****** key support for friday,,longs don't want it to open below that on Friday morning!!
1207.50 - 09.50 Thursdays RTH open and low volume
1202 - 1204.75 - VPOC from Thursdays O/N session
1197- 98.75 Gap and VPOC from ON
87 -91 VPOC and low volume - may rotate here a bunch to fill in the profile
84.50 - low volume area begins and HV from composite
78 - 81 ***** major support , the center of the universe....we have been watching this number for a long time
Here's what I've got with potential Price Action Support levels to the down side on the 30min chart (after consulting multiple time frames). The BLUE lines w/the Magenta lines as only semi-significant.
The Light Blue dashed lines are the Wkly Pvts. And the Yellow line is this year's high from the June ES contract.
I've also drawn in the Fib Retracement lines of .38 and .61 since they are close to other significant levels - confluence.
While there are a helluva lotta lines on the chart ... understand that it's almost a 40 point range of price activity displayed of just the past few days.
Obviously, I've nothing to offer here to the upside. But also want to point out what look like the more key price levels I'm seeing so that I don't get slagged for having a gazillion lines that obscure the price.
Click image for original size
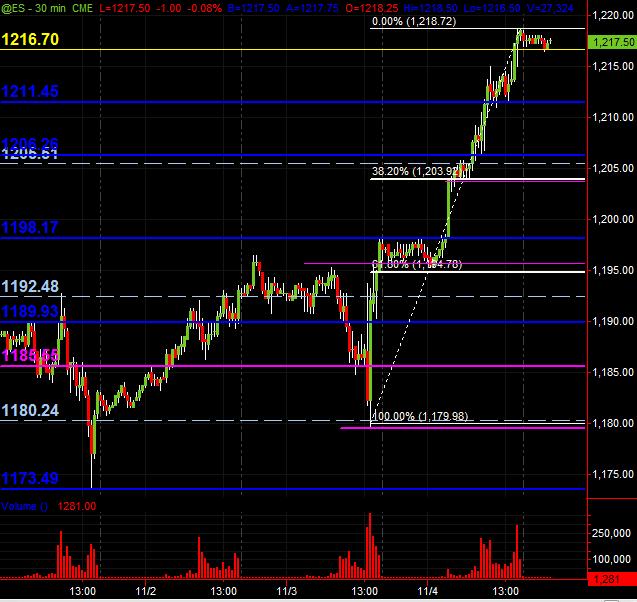
1211 zone may be a bounce area
1206-1204 significant PASR support ... and semi-signif support ... Wkly Pvt ... and 382 Fib Retracement
1198 next potential PASR level of support BUT
1195 zone eems more significant with confluence of PASR support with the 618 Fib Retracement
Then again, the (un)employment report hits pre-mkt ... which may be a giant horse-fly in the ointment.
9 to 1 up volume today...we don't usually see much follow through on the very next day...we can only hope we get higher prices from the early reports to set up the sells in RTH......
I said we might hit every line on your chart !
Unemployment for October being released early this morning.
My bias is neutral, will be looking for short setups at VAH (1216.75) and yesterday's High ( any short setup > 1218.00).
Normally I would expect a narrow range inside day, normal distribution day type, but with the volatility associated with the UE report coming out in a few minutes we could easily see another wide range day. Looking back at the week, with the exception of Tuesday, every day this week has had a wide range.
shorting 21.25 ,,,,NOW......markets don't leave two previous days highs untouched too often...will add at 25 if needed
so the key statistic to ask yourseld is how often do we open in RTH and not trade back to previous days highs two days in a row....?
YD we opened and never traded back to Wednesday high....so today ANY open gap above YD RTH HIGH will/should retest that high from thursday....hopefully that is clear...hence my shorts here in the Overnight session
YD we opened and never traded back to Wednesday high....so today ANY open gap above YD RTH HIGH will/should retest that high from thursday....hopefully that is clear...hence my shorts here in the Overnight session
With you on that short Bruce, in short at 1221.00.
VWAP at 1217.00 looks like a reasonable target, POC at 1213.50 below that.
VWAP at 1217.00 looks like a reasonable target, POC at 1213.50 below that.
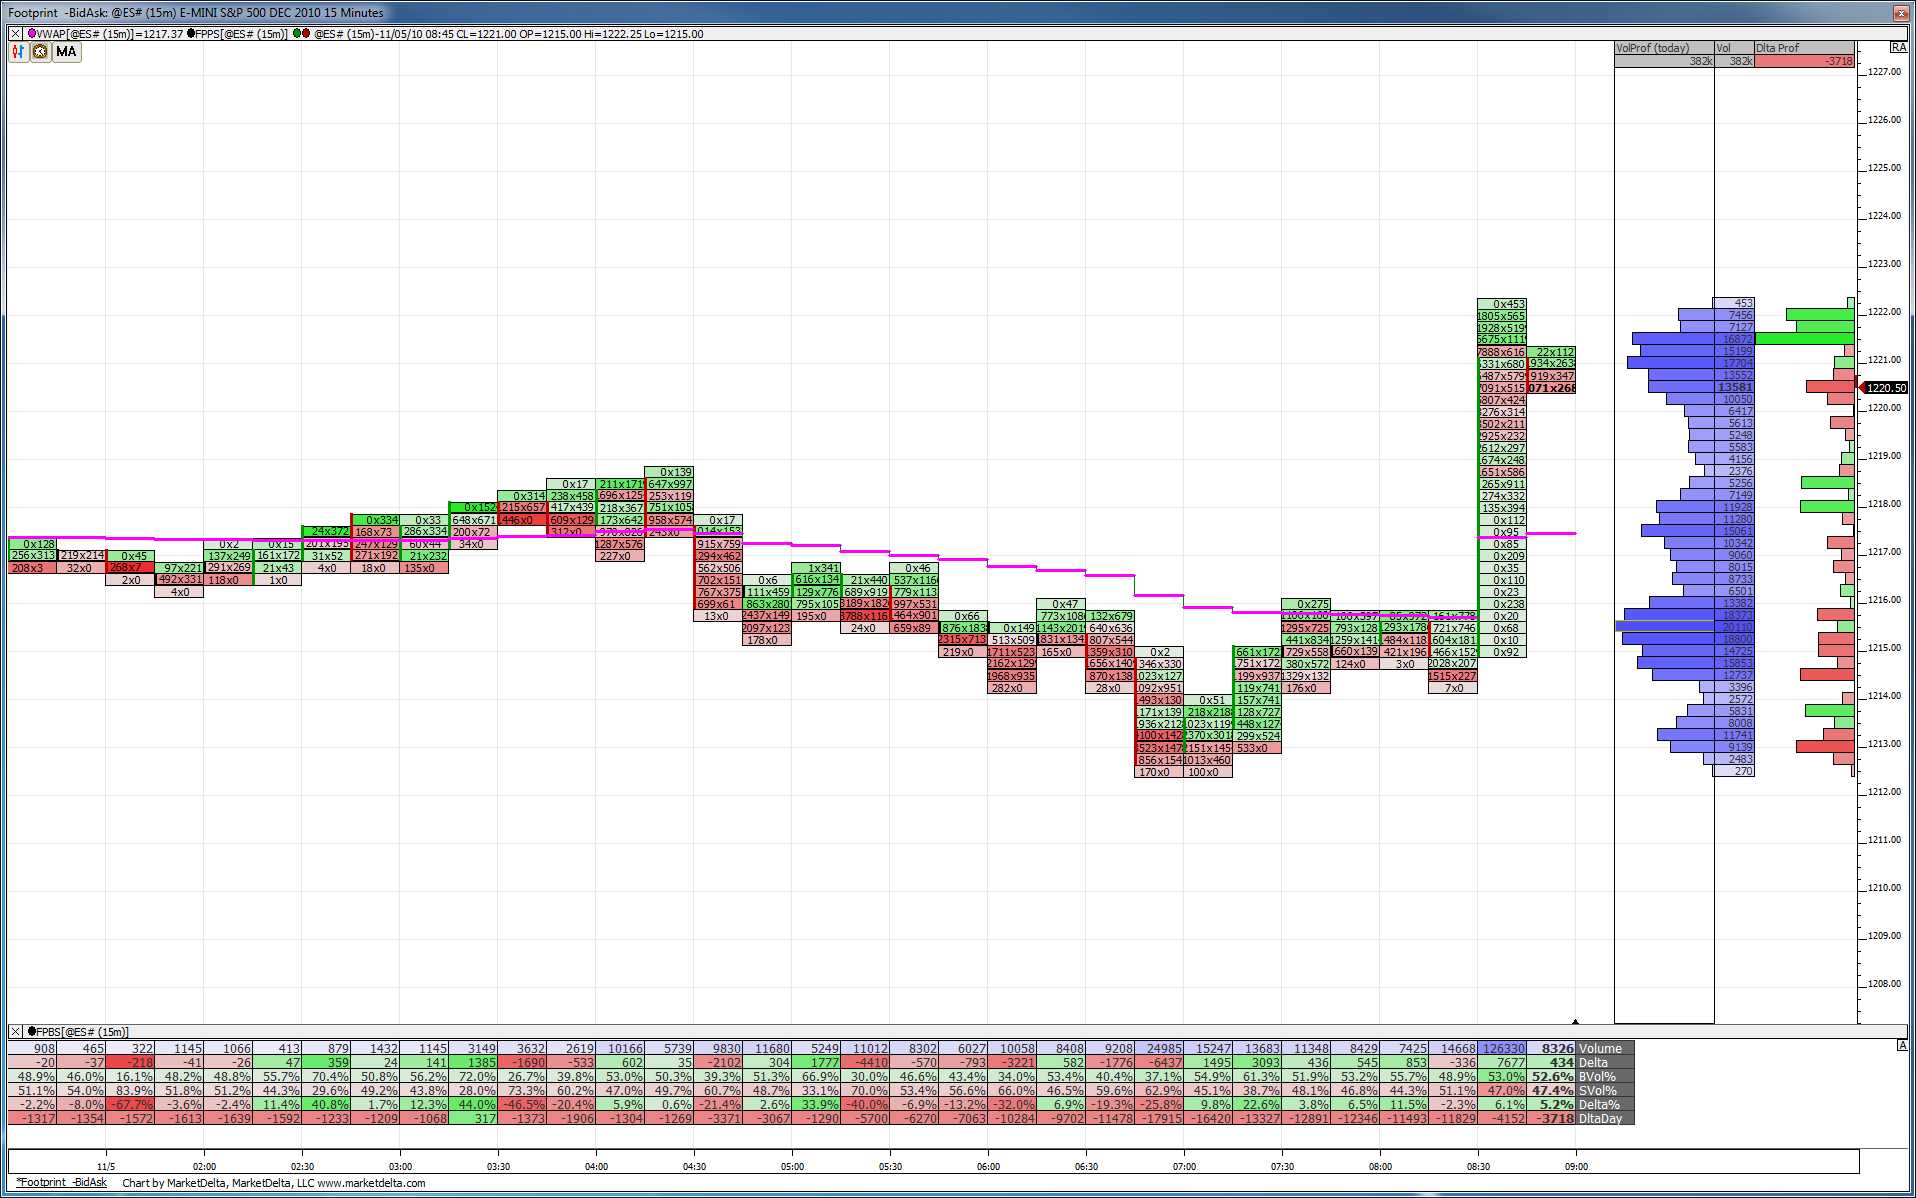
Here is the footprint after the news. Quite a bit of volume entered up in the 1121 zone.
Click image for original size
cool PT..lets hope they go for the midrange...but tightening at YD highs...more agressive today on O/N trades due to that 9 to 1 volume
1215 is O/N VPOC!!!
1215 is O/N VPOC!!!
lately these little surges of buying and selling have been coming in at 9 -9:10 EST in O/N.......just an FYI....
Emini Day Trading /
Daily Notes /
Forecast /
Economic Events /
Search /
Terms and Conditions /
Disclaimer /
Books /
Online Books /
Site Map /
Contact /
Privacy Policy /
Links /
About /
Day Trading Forum /
Investment Calculators /
Pivot Point Calculator /
Market Profile Generator /
Fibonacci Calculator /
Mailing List /
Advertise Here /
Articles /
Financial Terms /
Brokers /
Software /
Holidays /
Stock Split Calendar /
Mortgage Calculator /
Donate
Copyright © 2004-2023, MyPivots. All rights reserved.
Copyright © 2004-2023, MyPivots. All rights reserved.