MyPivots
Sign In
JA
jarek
Rep: 94
Posts: 3,474
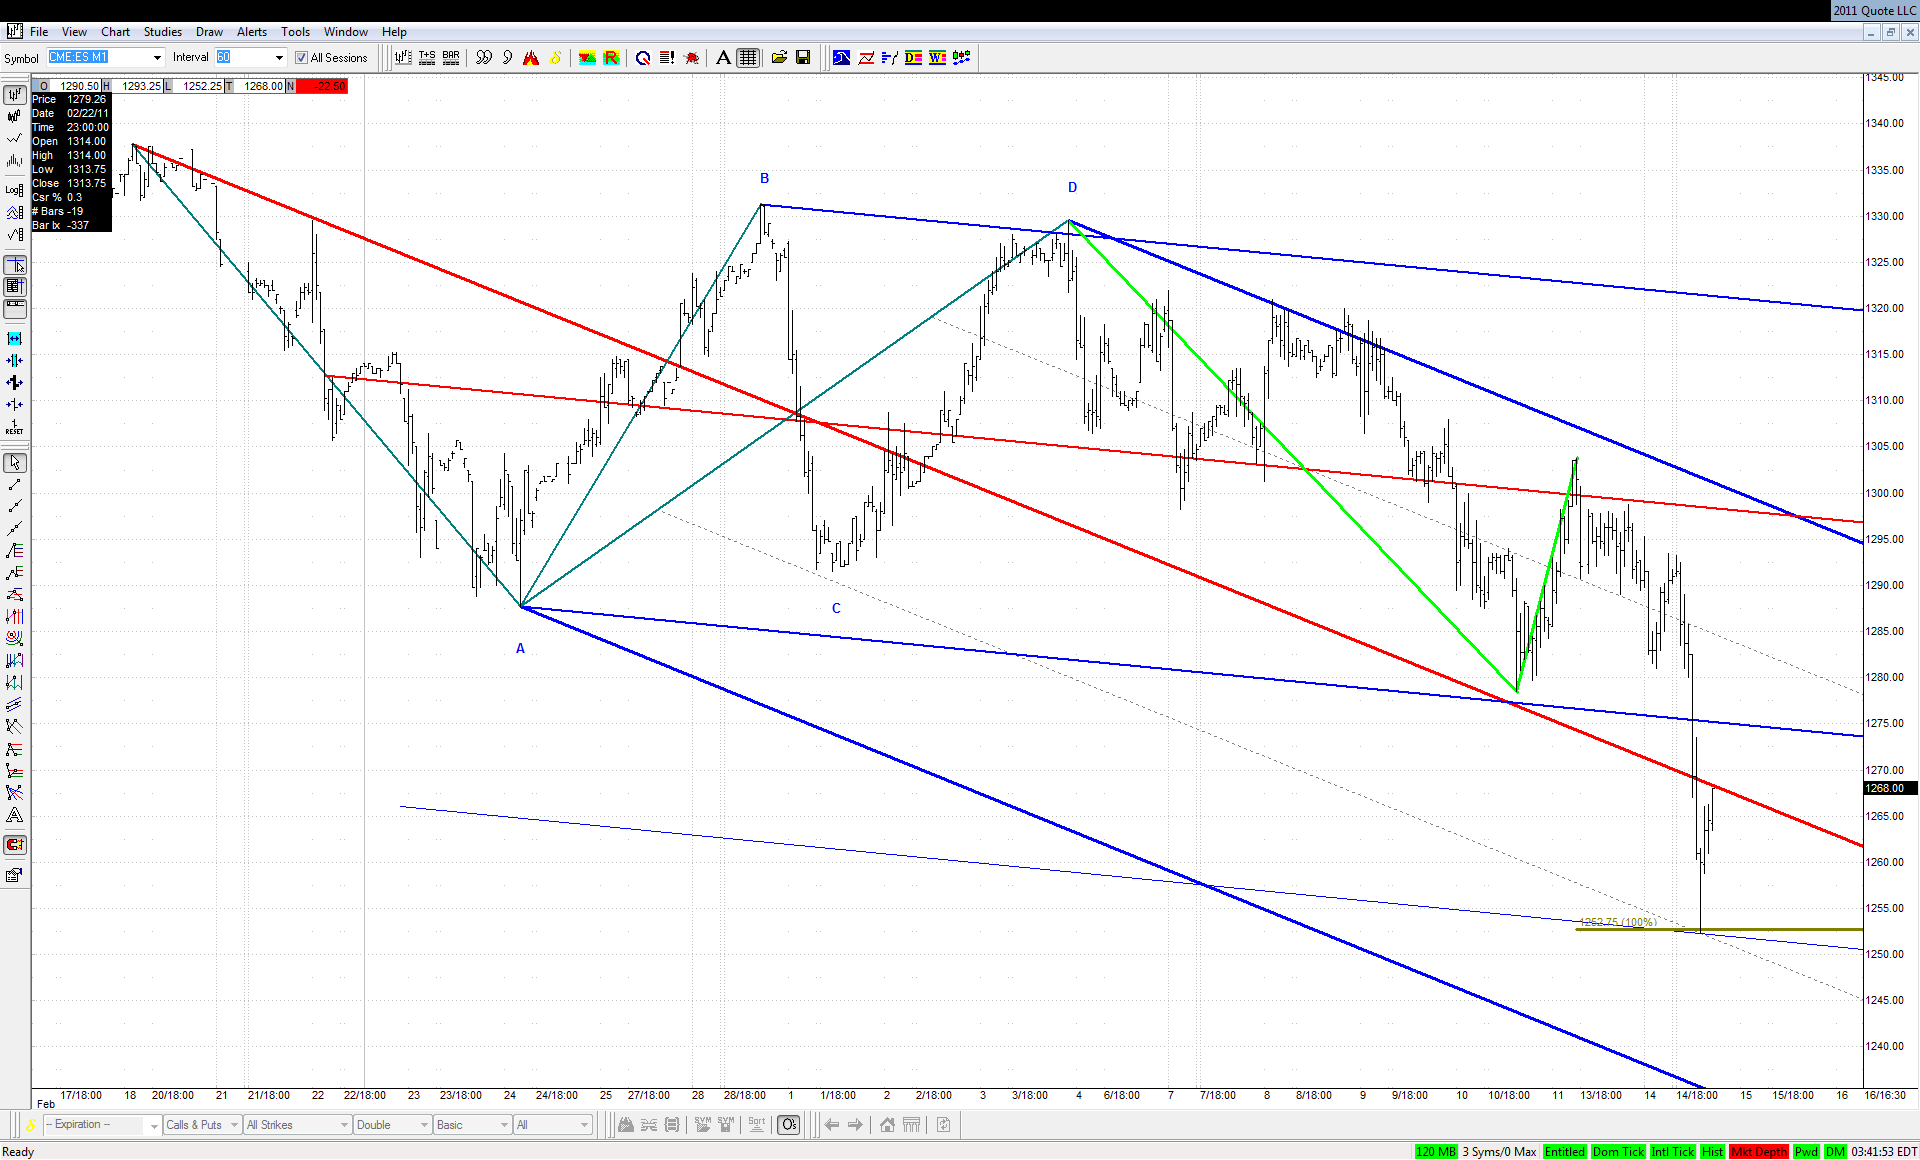
There is not much to add to the extensive coverage of the recent weeks here. While looking for geometry of Friday's turn on the continuous contract basis I came up with the following picture:

Click image for original size
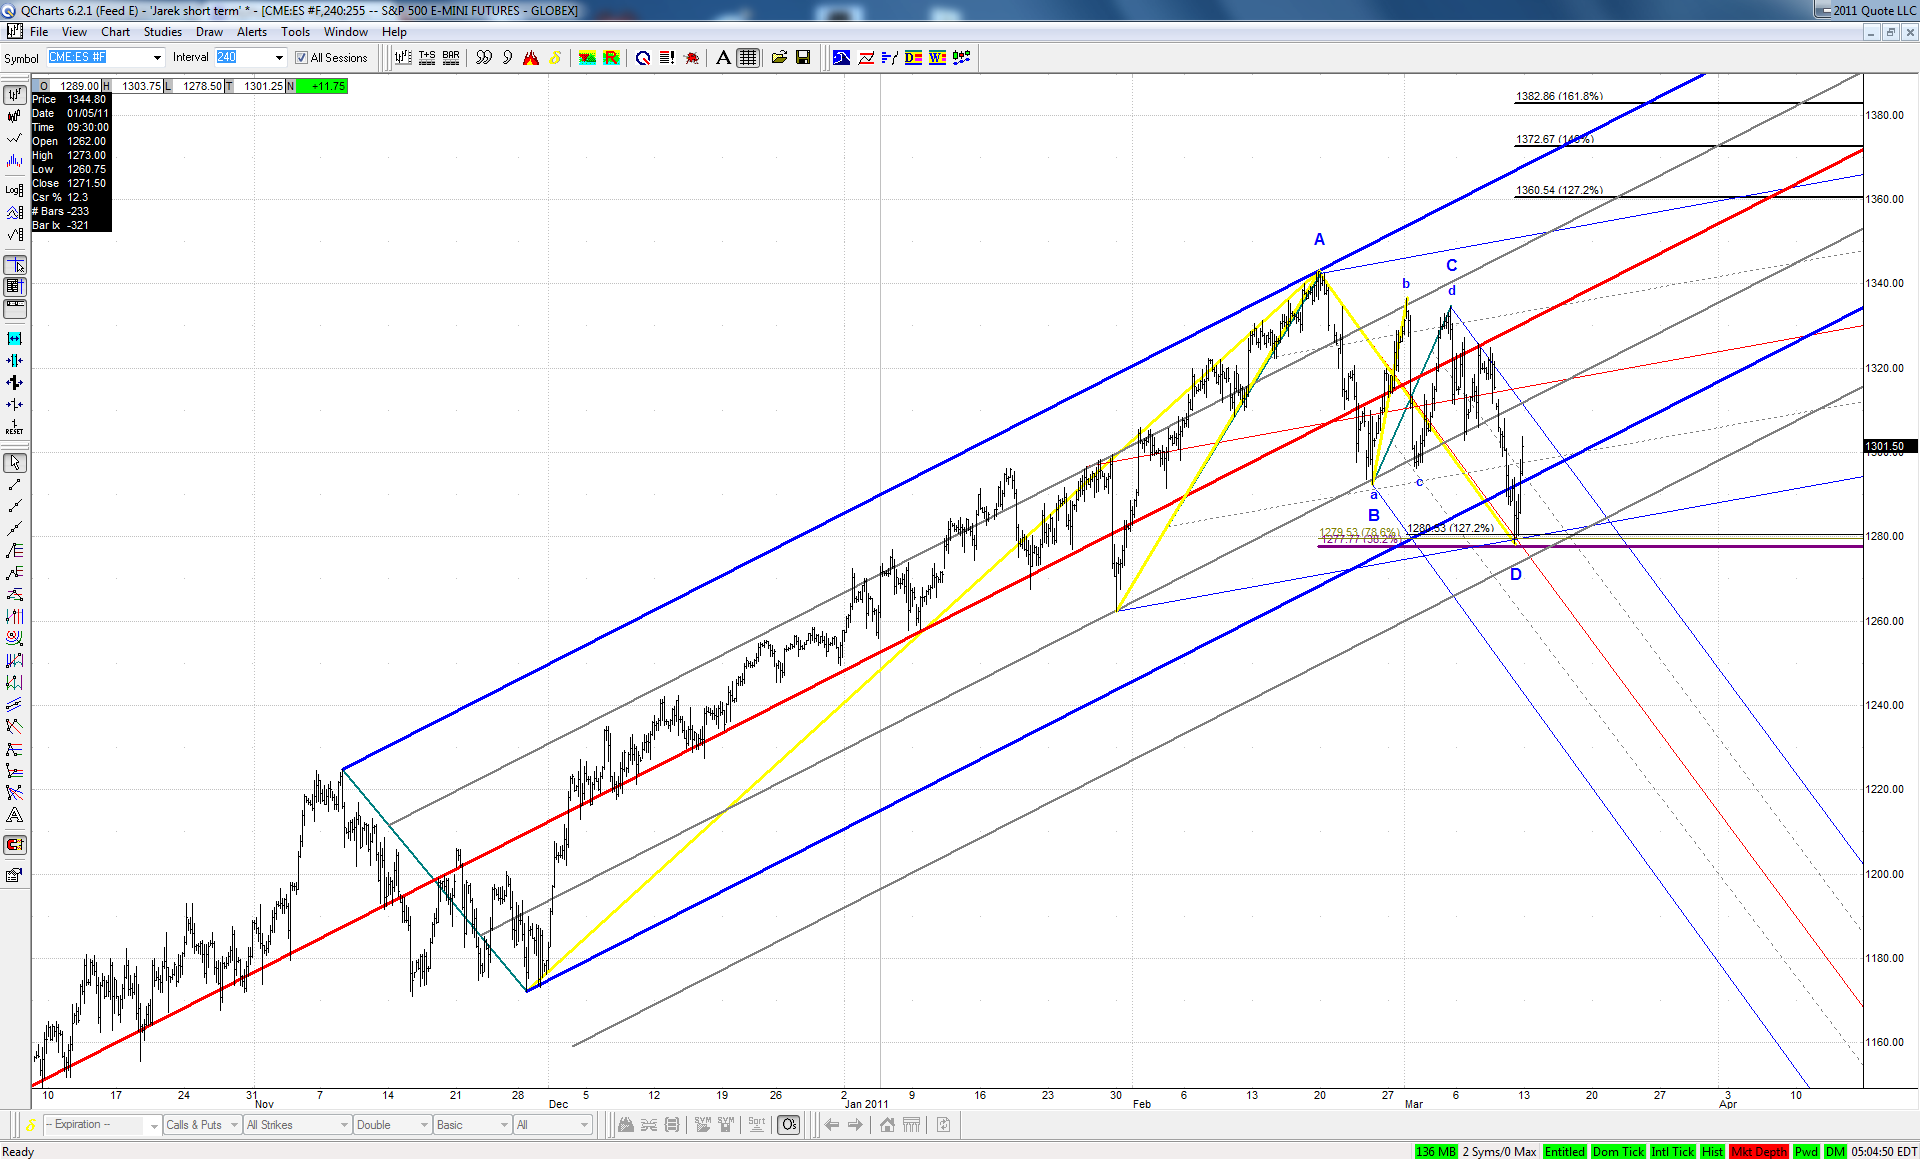

We have an almost ideal .382 bullish ABCD here. Thanks to Roofer's findings based on thousands of examples we know that probability of taking out the high equals in such case 87%. What's more in order to hit Jim's target zone at the line, a pretty fast move would be required... We'll see next week if we are on the right track and ... in the right train
ER
EricD
Rep: 63
Posts: 692
Hi Jarek...Markets never sleep....Hard Way to Make an Easy Living..
ER
EricD
Rep: 63
Posts: 692
update...
Click image for original size
JA
jarek
Rep: 94
Posts: 3,474
Originally posted by roofer

over the months of jan and feb across hundreds of stocks the geometry of a crash built like the snow pack of a potential avalanche...hundreds of stocks with mimimum targets AND crash targets..

Great, great respect again Geo! From what you write it is not the first time the geometry foretells real life dramatic events. It is the first time however I see it developing "live". And I'm in awe thinking about the power of geometry...
JA
jarek
Rep: 94
Posts: 3,474
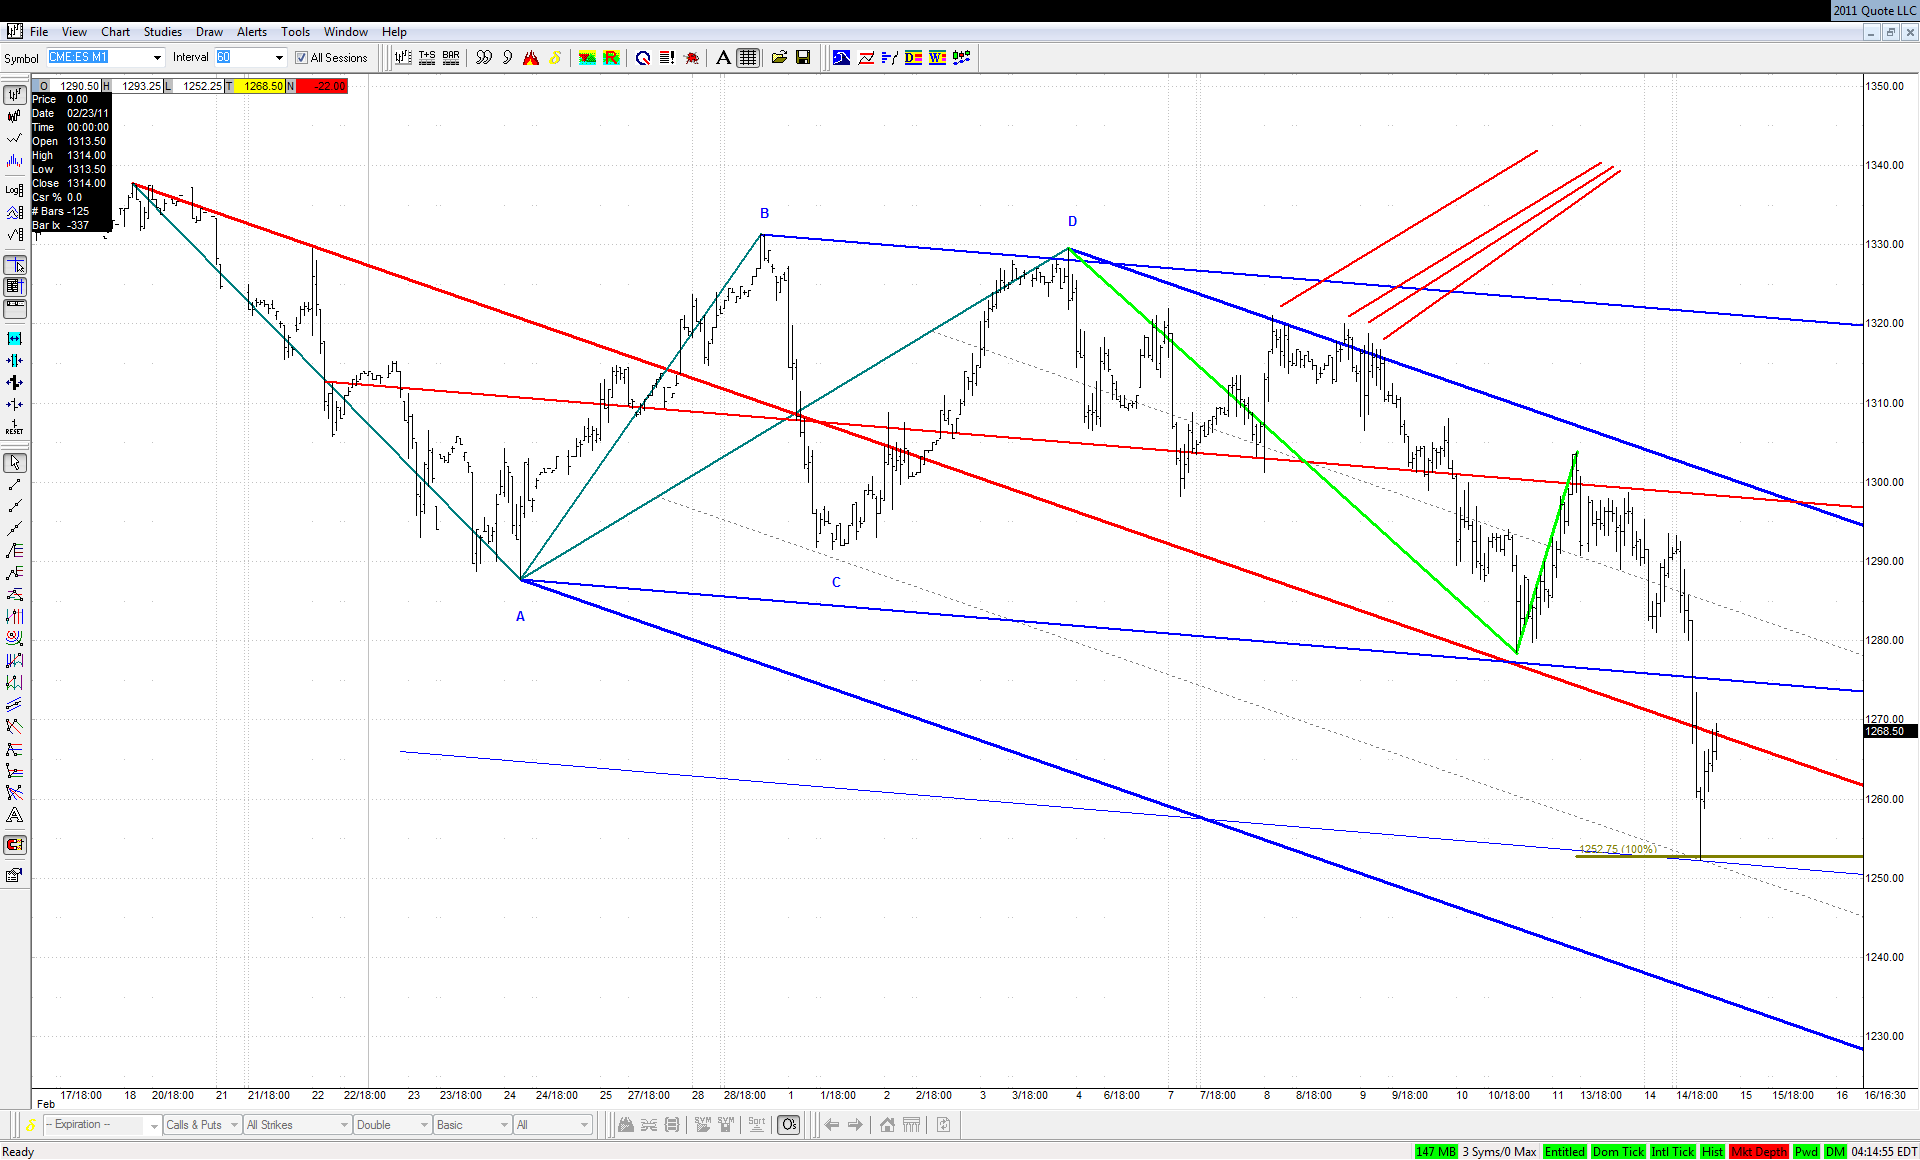
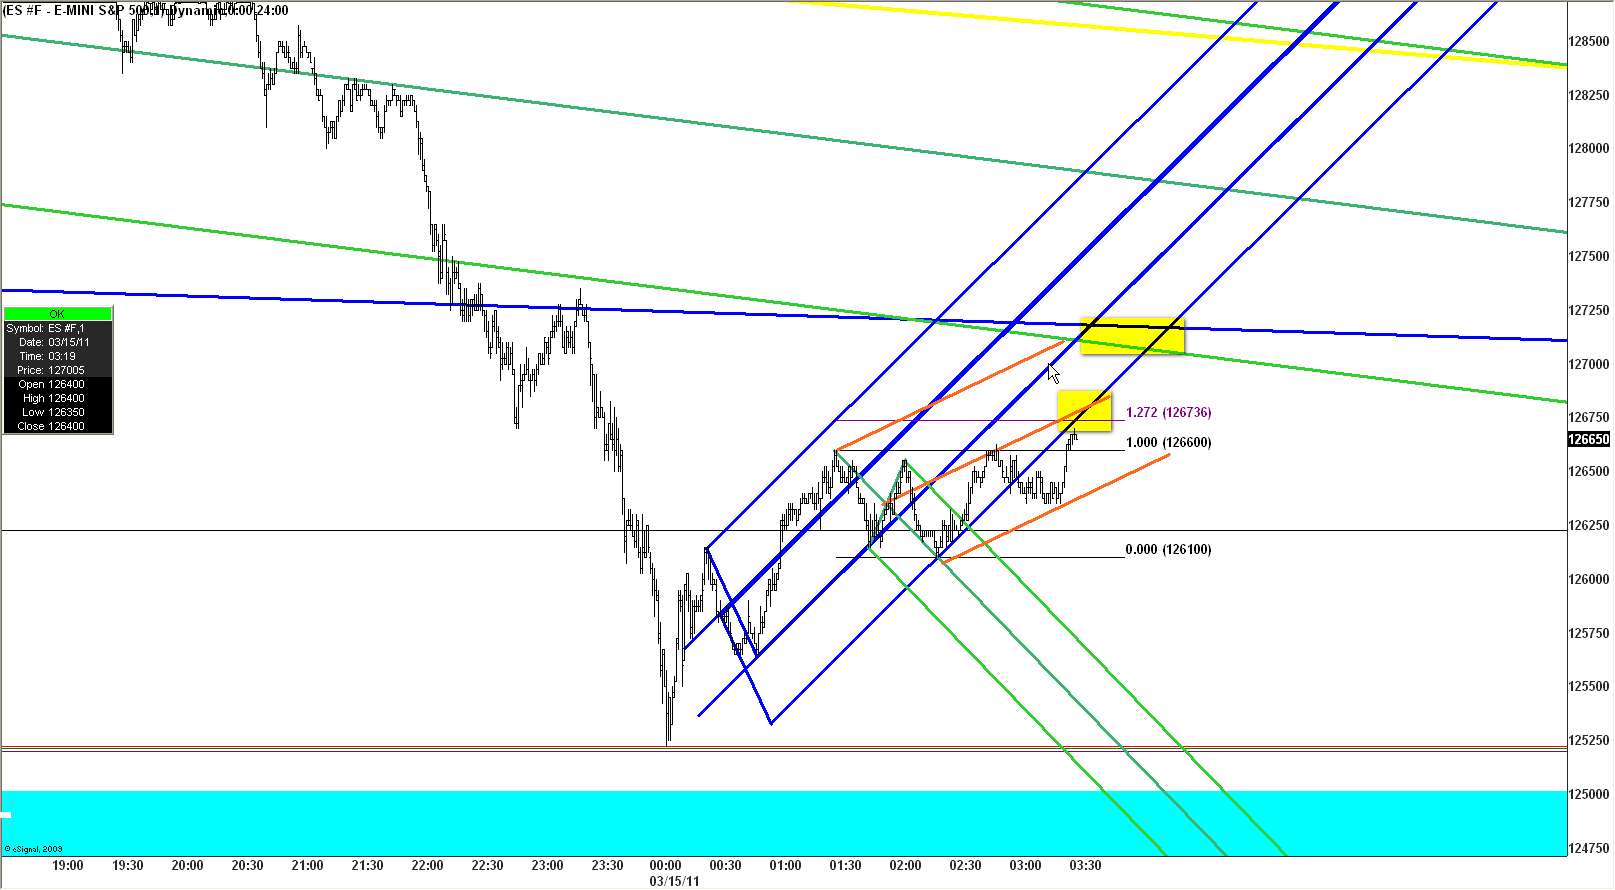
Similar to Eric, on my chart the overnight bottom lies exactly at important geometry:

Click image for original size


I suspect however that it needs to stay here or even get lower in order for the geometries of the issues not traded overnight to hit their respective targets...
ER
EricD
Rep: 63
Posts: 692
agree Jarek...watching this 1269ish area first for a reaction...wouldnt be surprised for a retest of the lows ...
JA
jarek
Rep: 94
Posts: 3,474
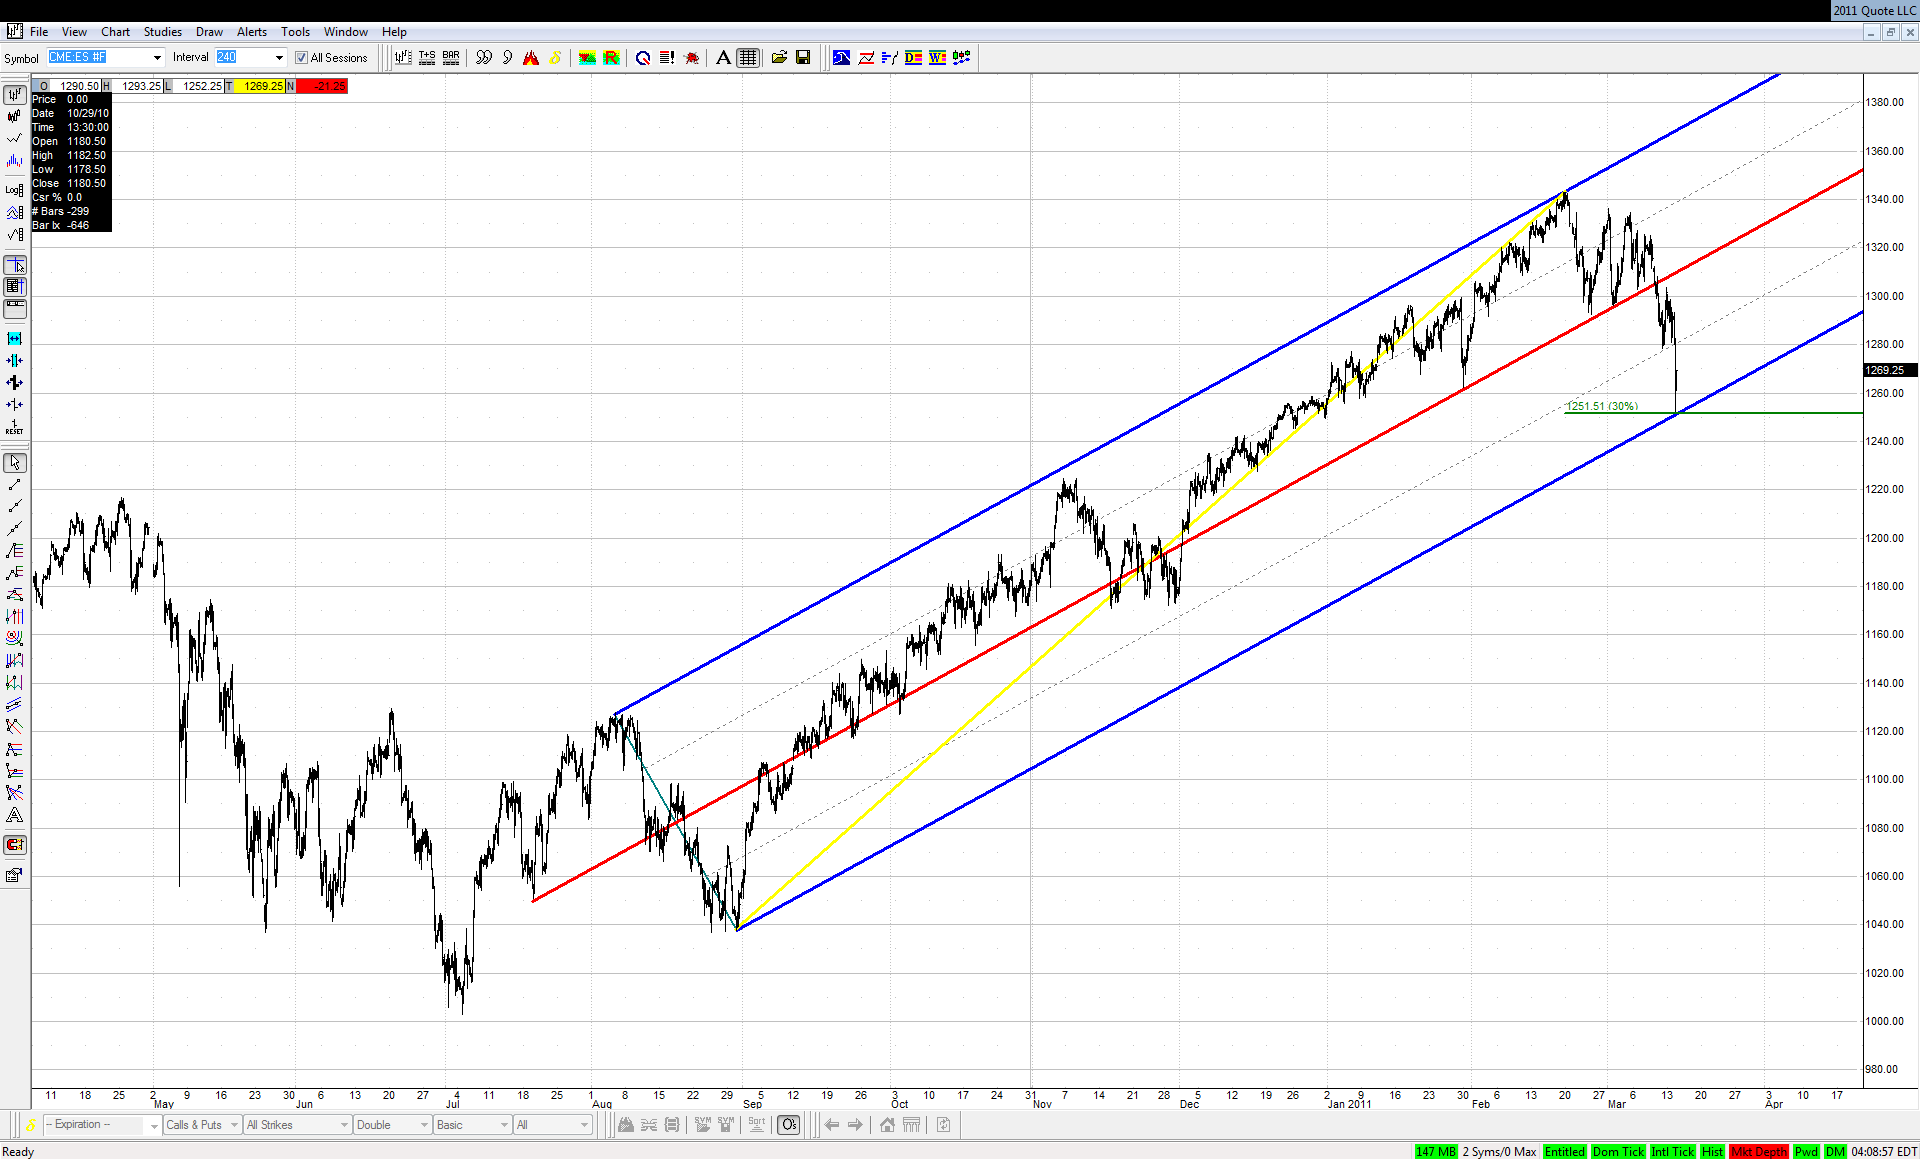
On one hand I see that there are not only short term geometries as shown above, but also the decline so far is in direct proportion to August 2010 drop:

Click image for original size
JA
jarek
Rep: 94
Posts: 3,474
... but on the other hand I wonder if this test and multiple retests of the upper ML last week do not foretell the drop to the lower ML at 1230-1240 area, where also the most distant geometries of the other issues could certainly be met:

Click image for original size


I guess it's better to stay out when one has such doubts...
JA
jarek
Rep: 94
Posts: 3,474
Originally posted by jarek

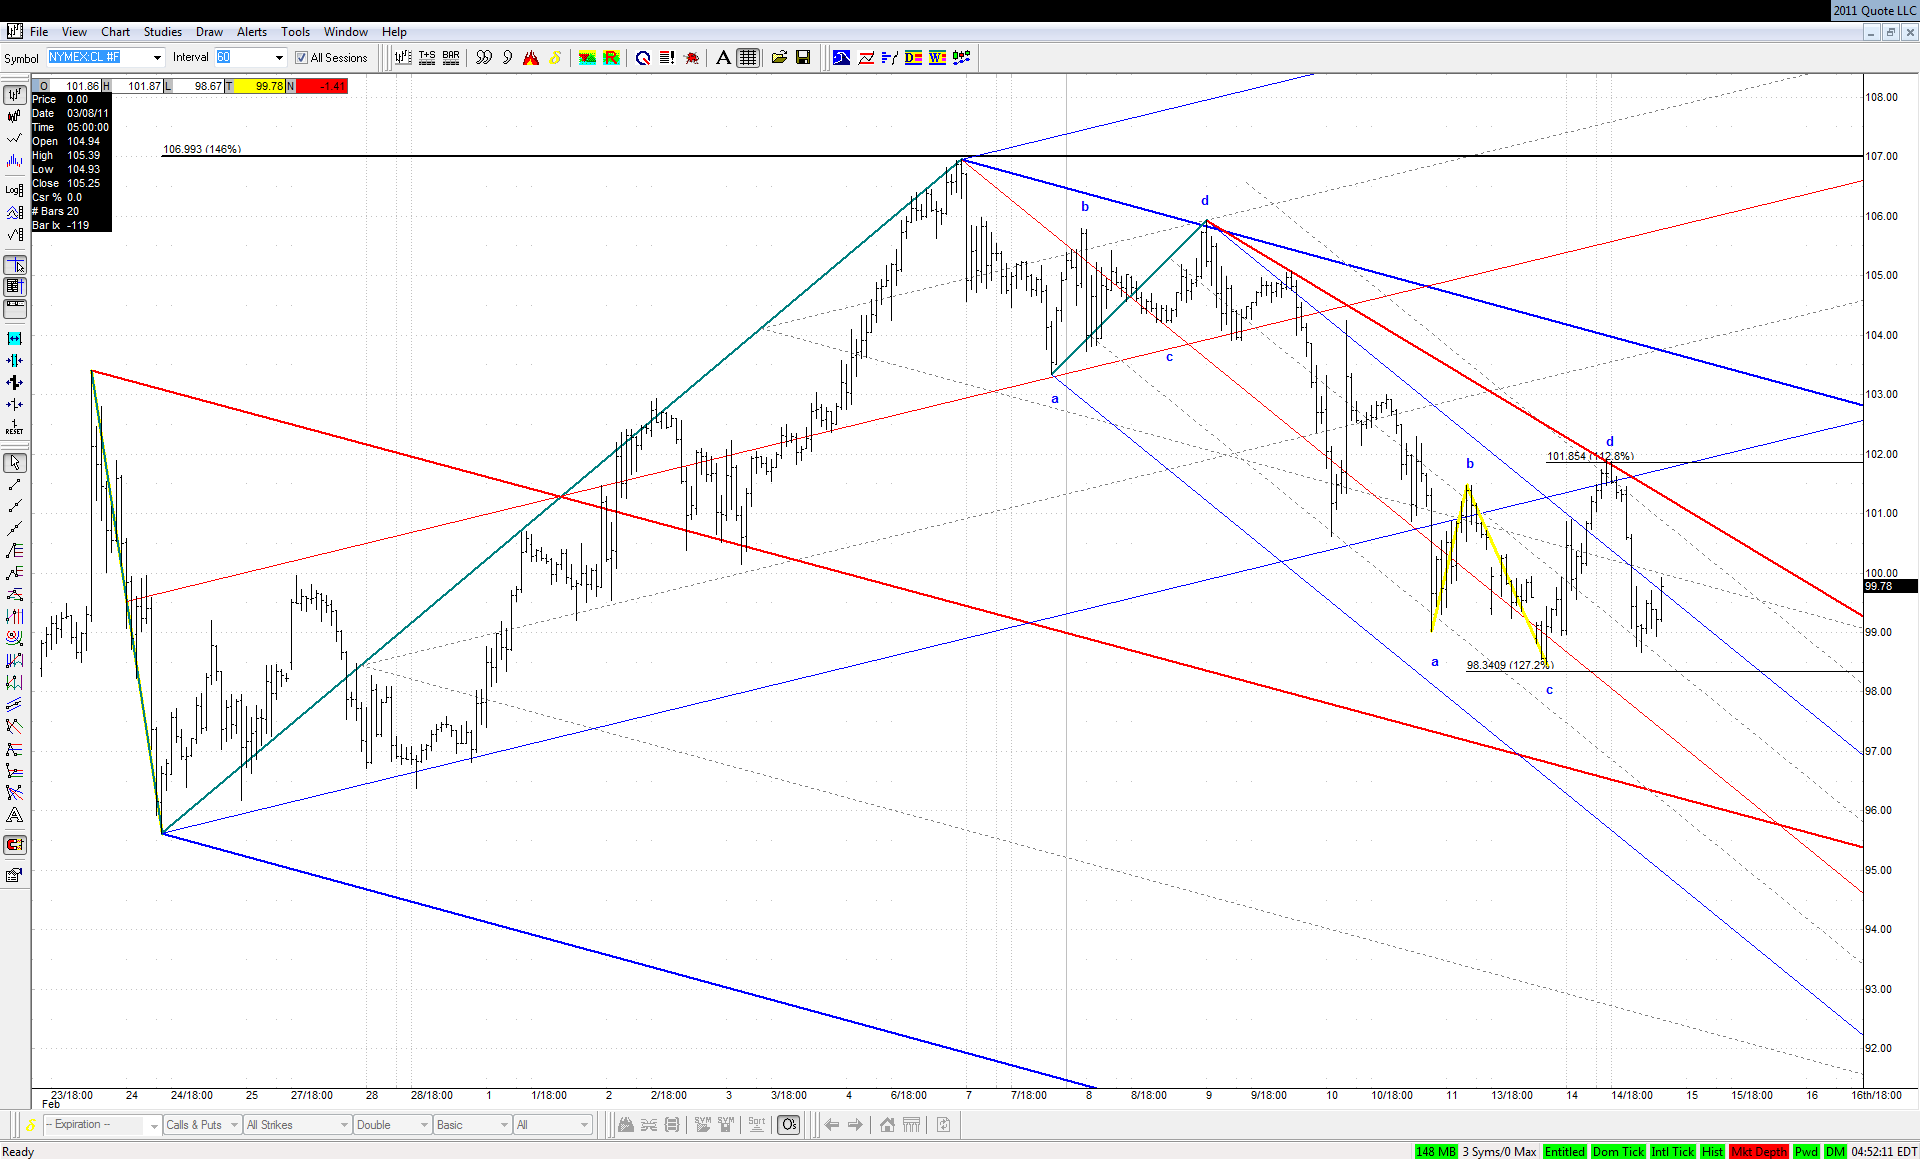
This bearish KZ TD ABCD at important line in Crude simply has to play out if the downsloping major ML is about to be reached in this move down...

And yet it didn't... It morphed into an EXP ABCD for a second backtest of this lower ML of the Schiff set:

Click image for original size


If this one doesn't play out either, then the major downsloping ML could not be reached at all in this move down and new highs would be looming over horizon. In this environment??
JA
jarek
Rep: 94
Posts: 3,474
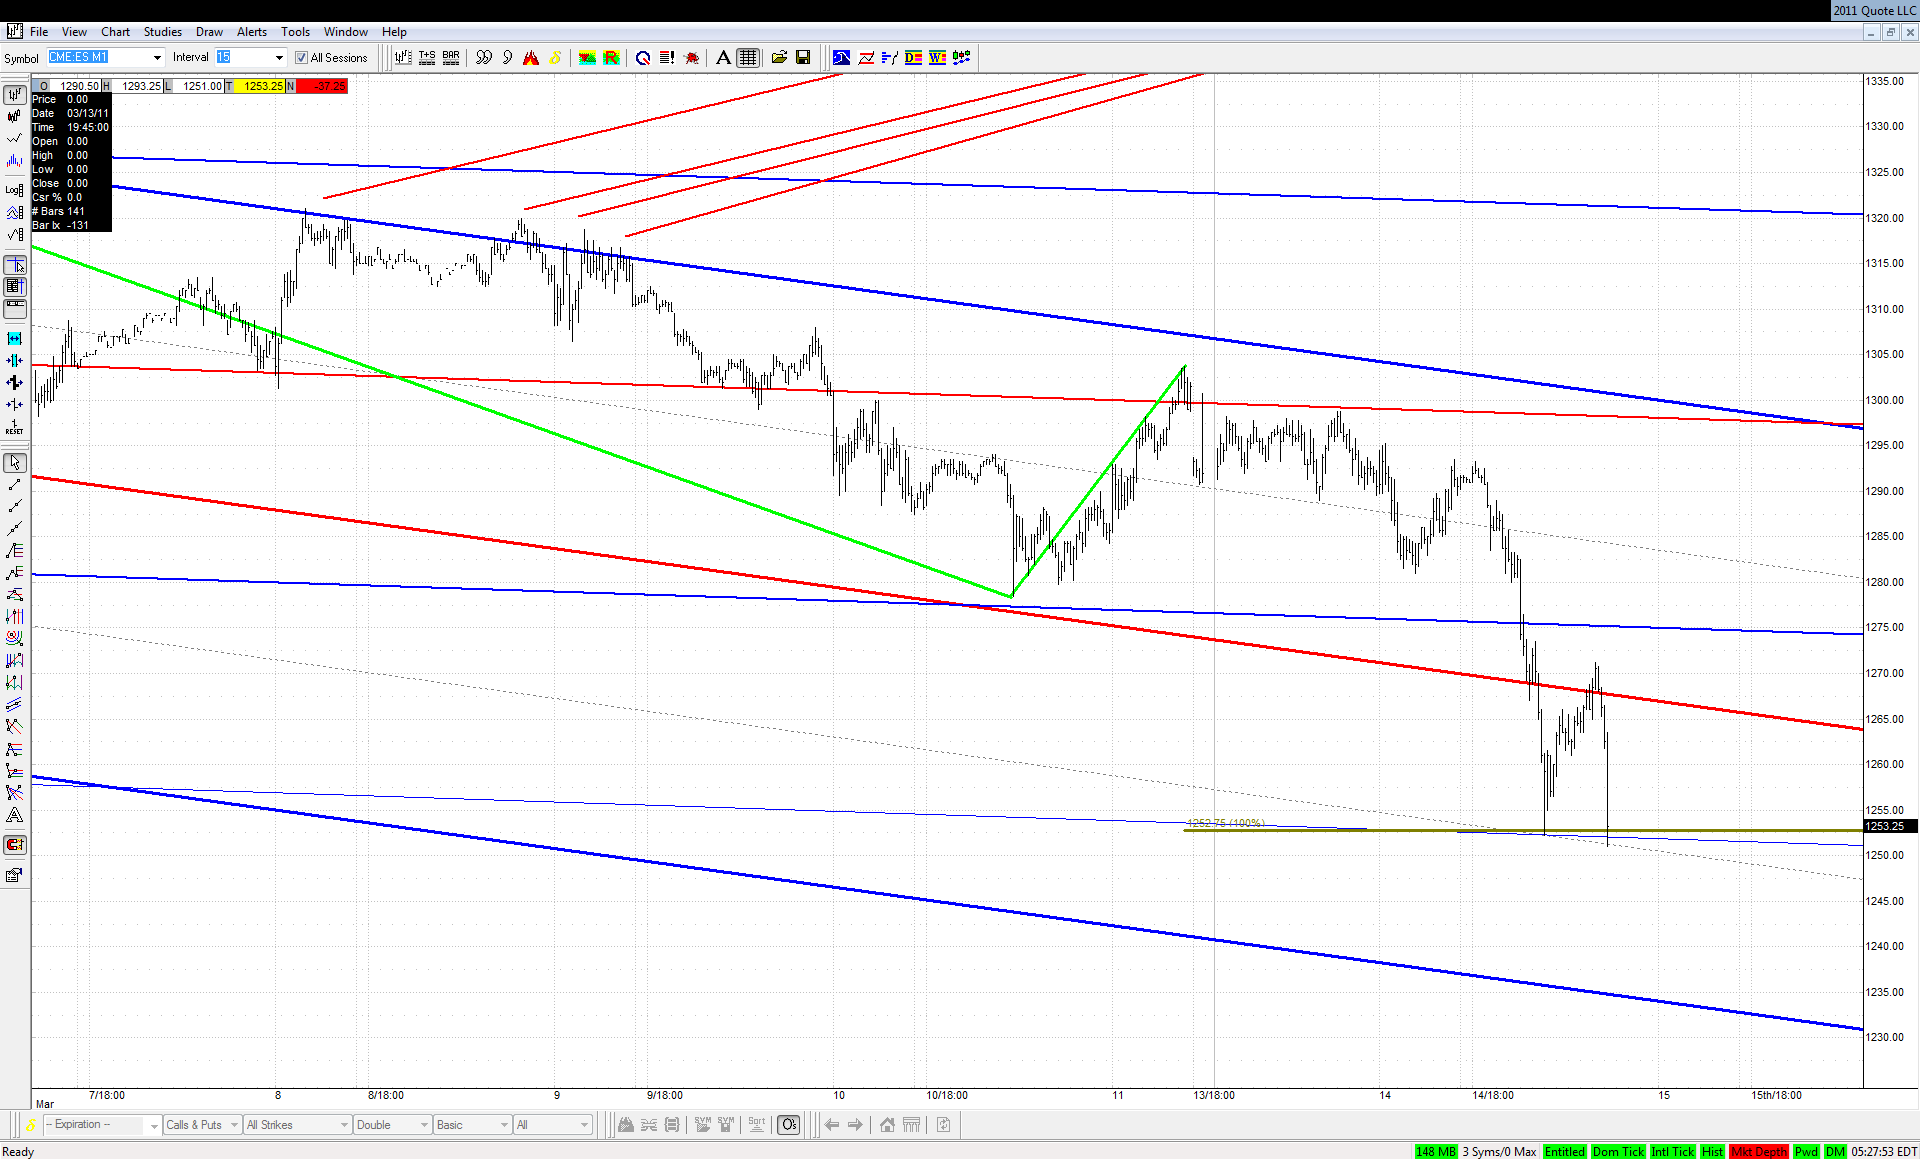
ES in a freefall again:

Click image for original size


This is going to be a long day for all the bulls out there...
JA
jarek
Rep: 94
Posts: 3,474
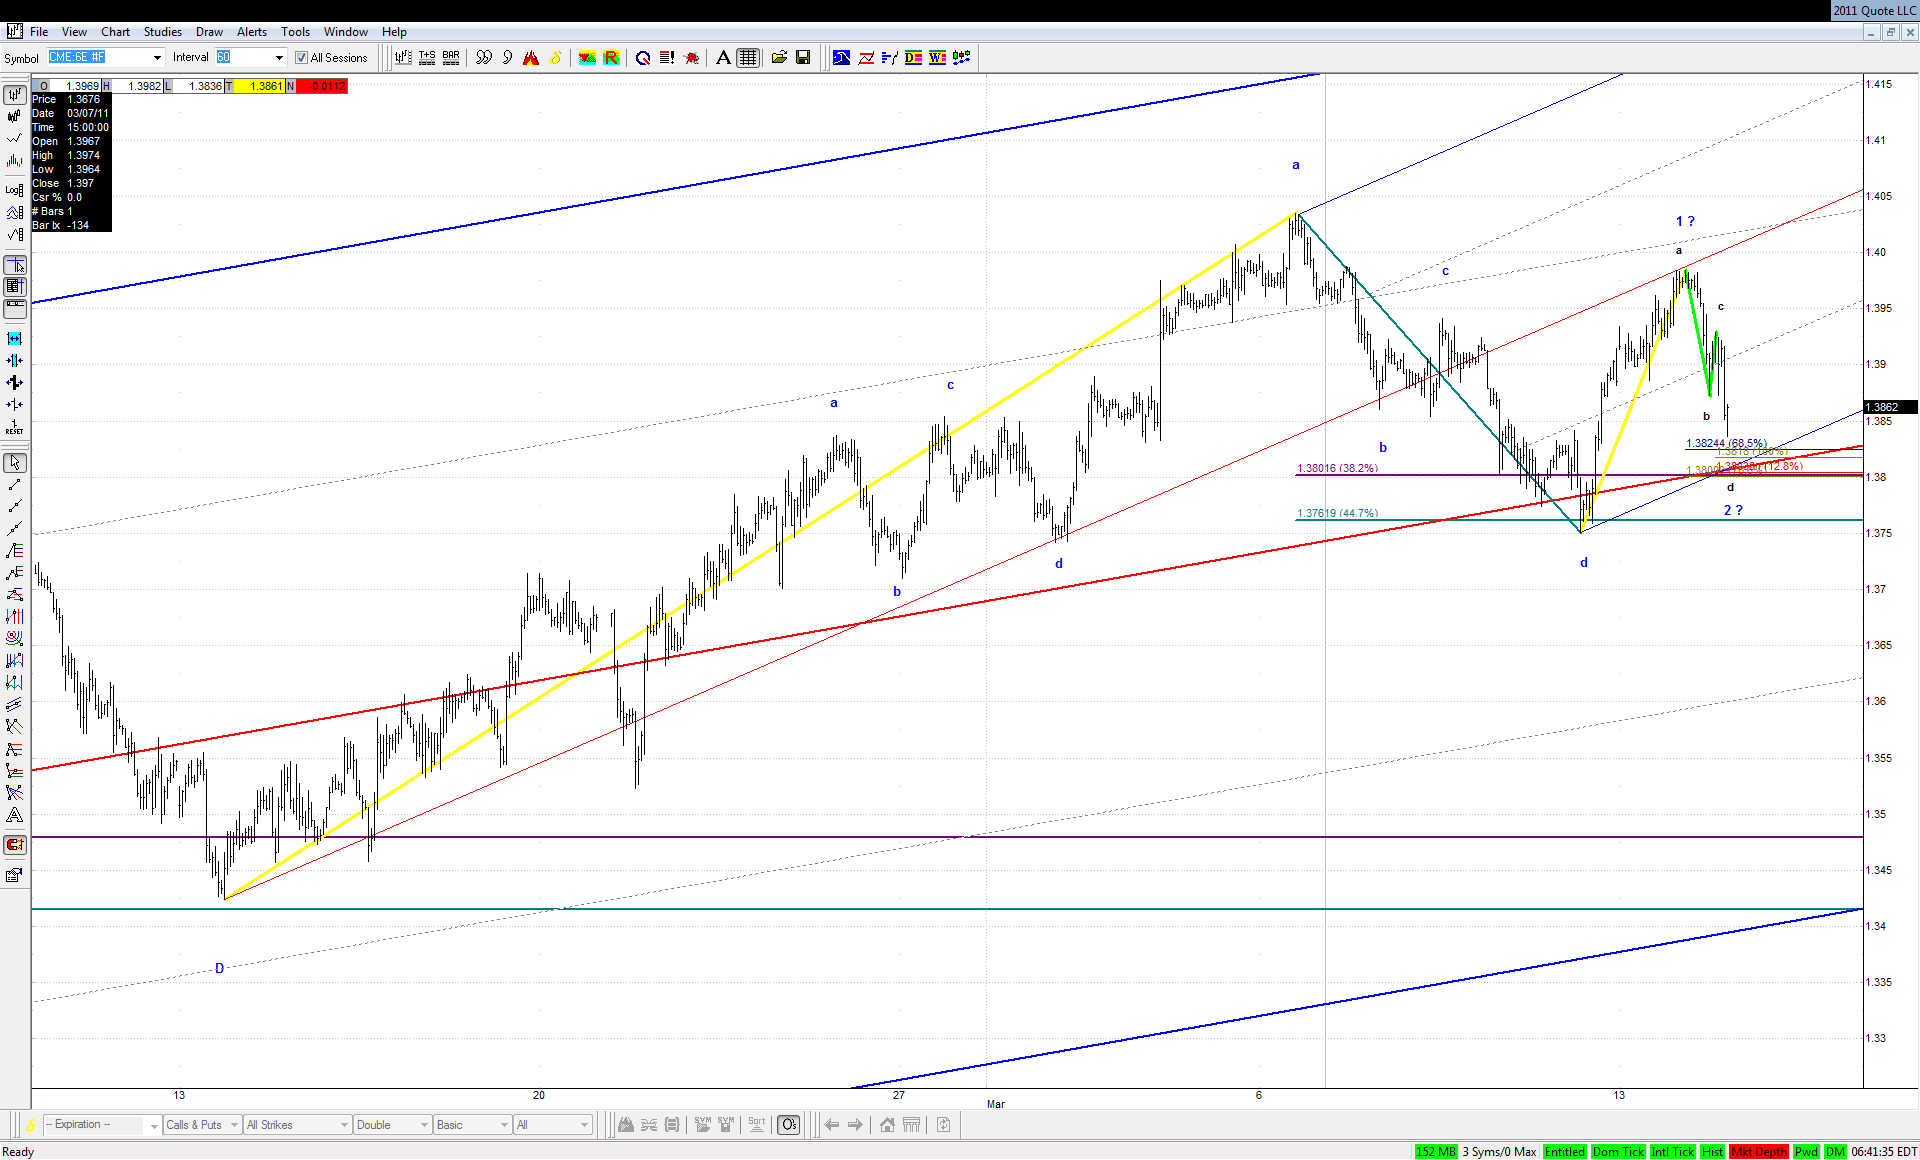
I'll be watching this confluence in EUR pretty closely:

Click image for original size
TX
tx_ches
Rep: -10
Posts: 514
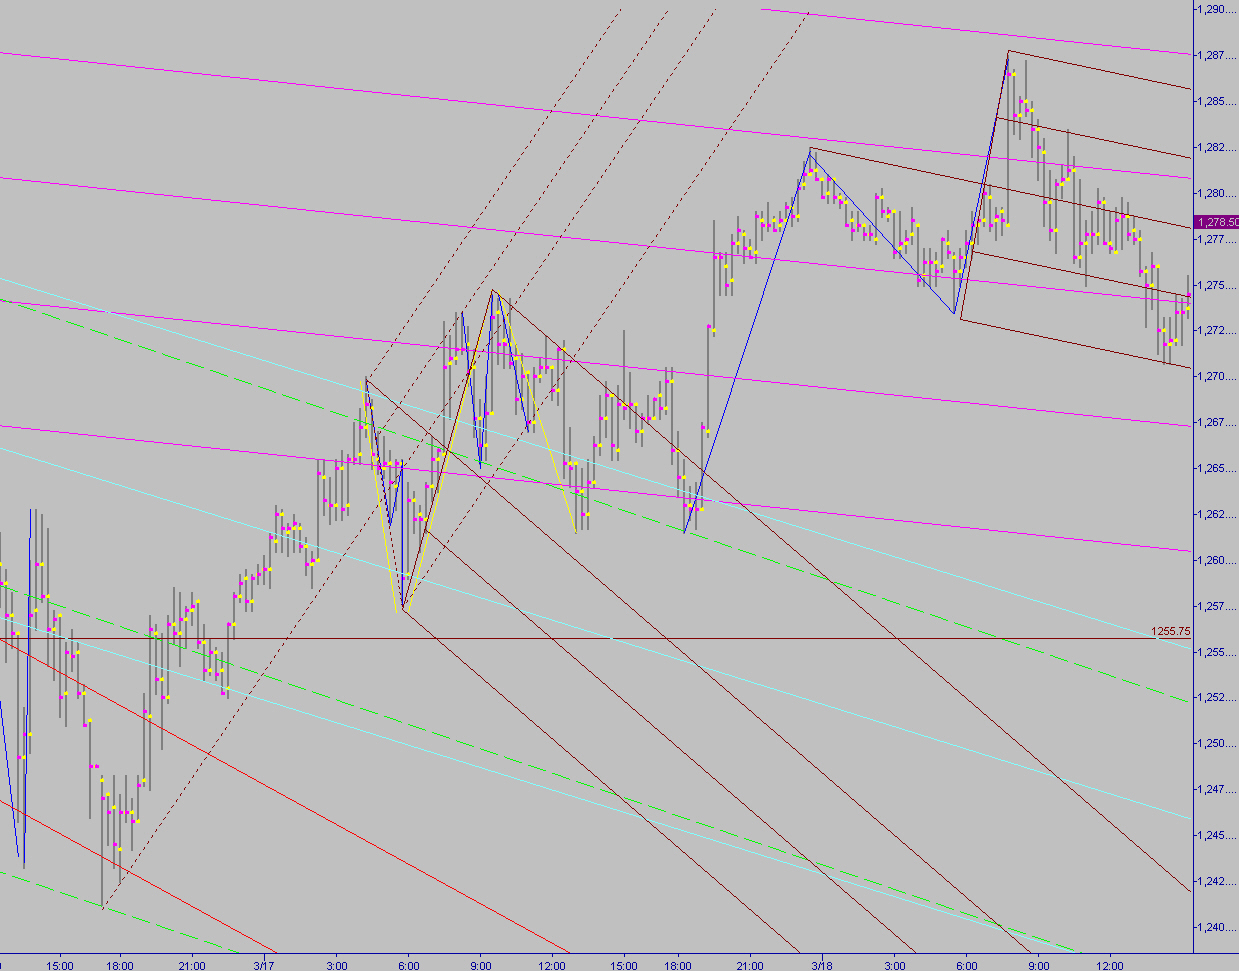
Practice work. I consolidated what Jarek did on the ES 15 minute chart. I'm only showing the last 2 days -- from where I left off on Wednesday.

Click image for original size