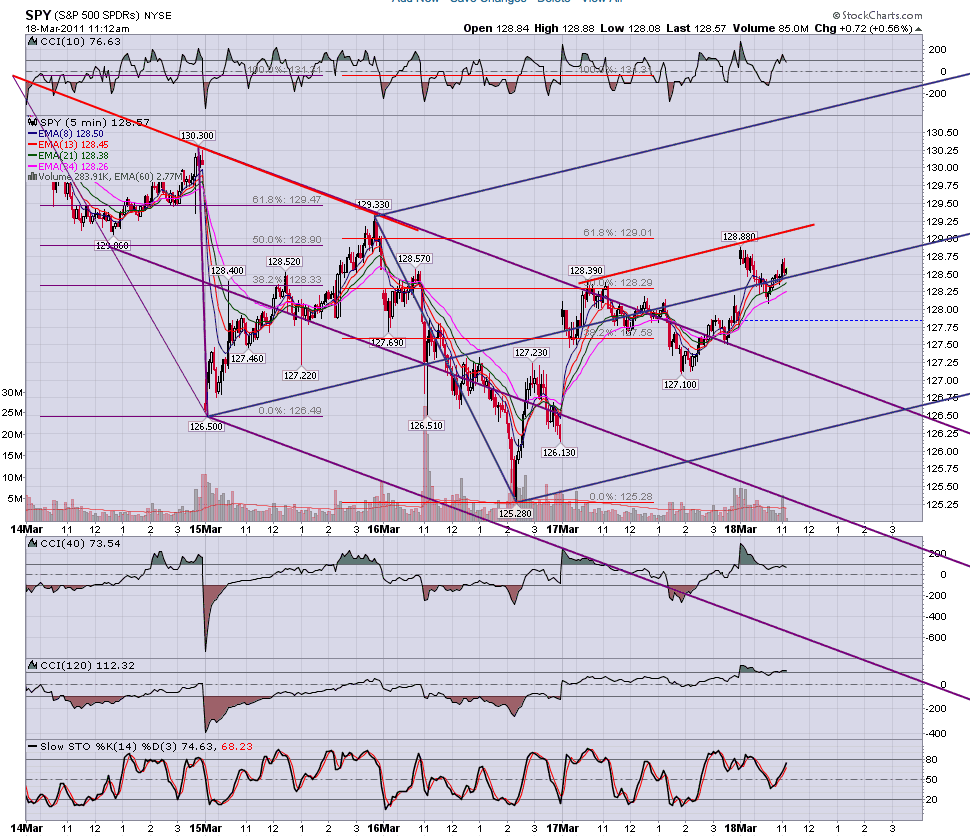
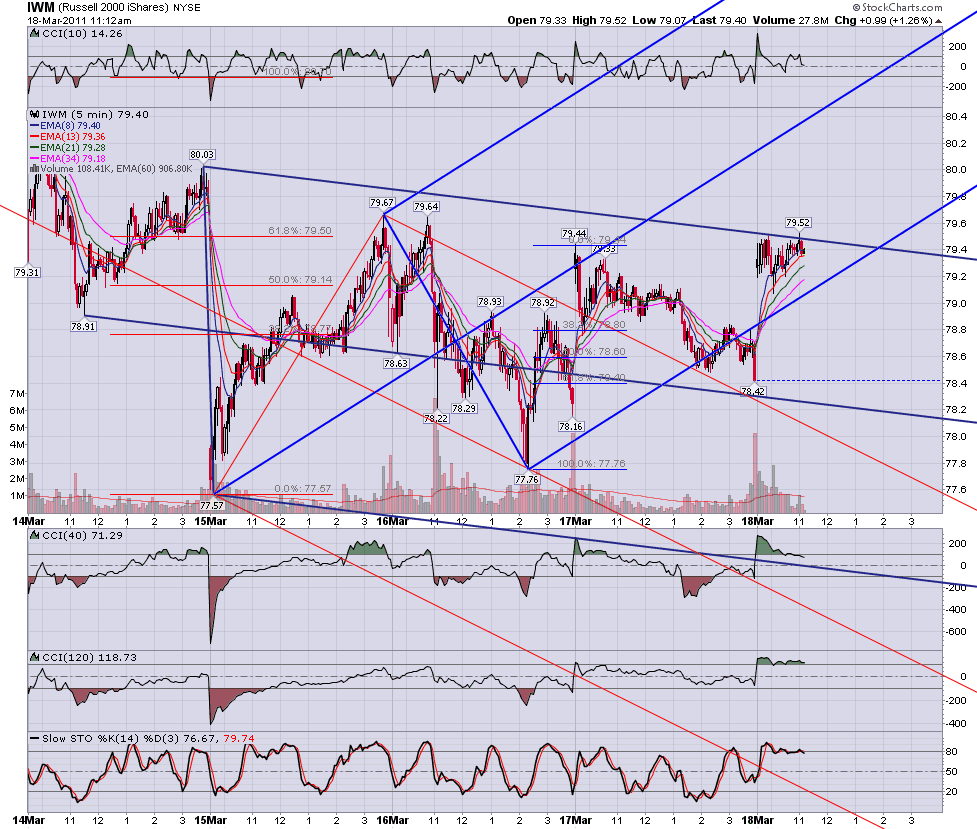
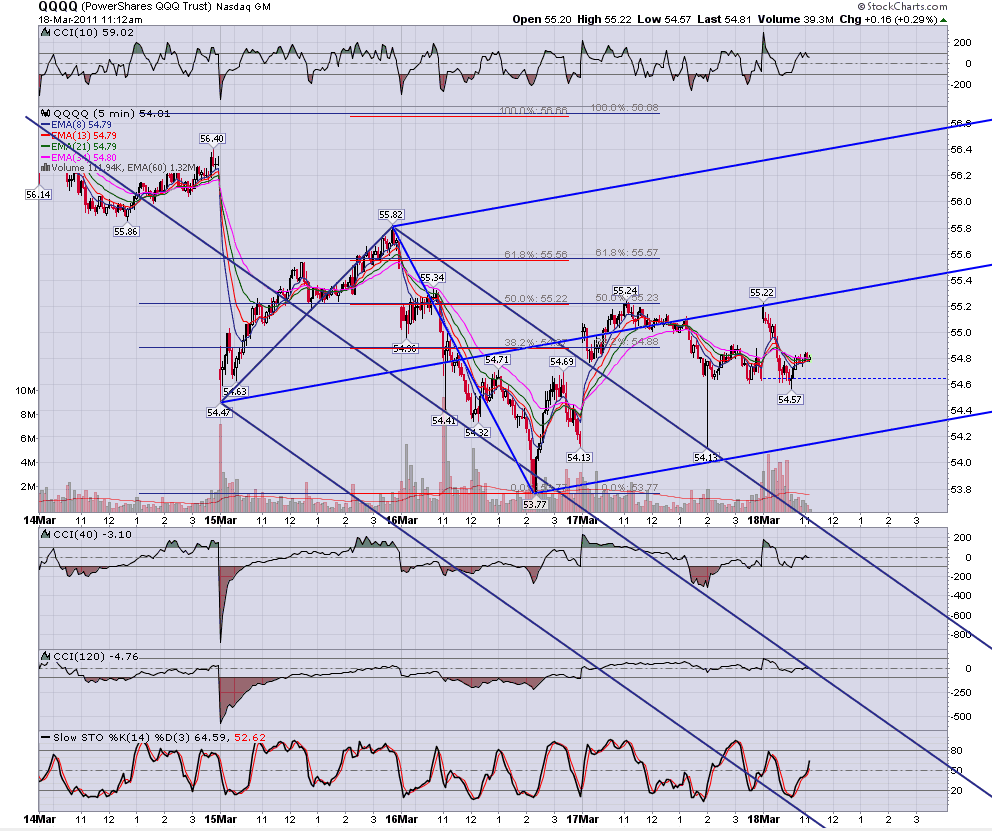
MyPivots
Sign In
JA
jarek
Rep: 94
Posts: 3,474
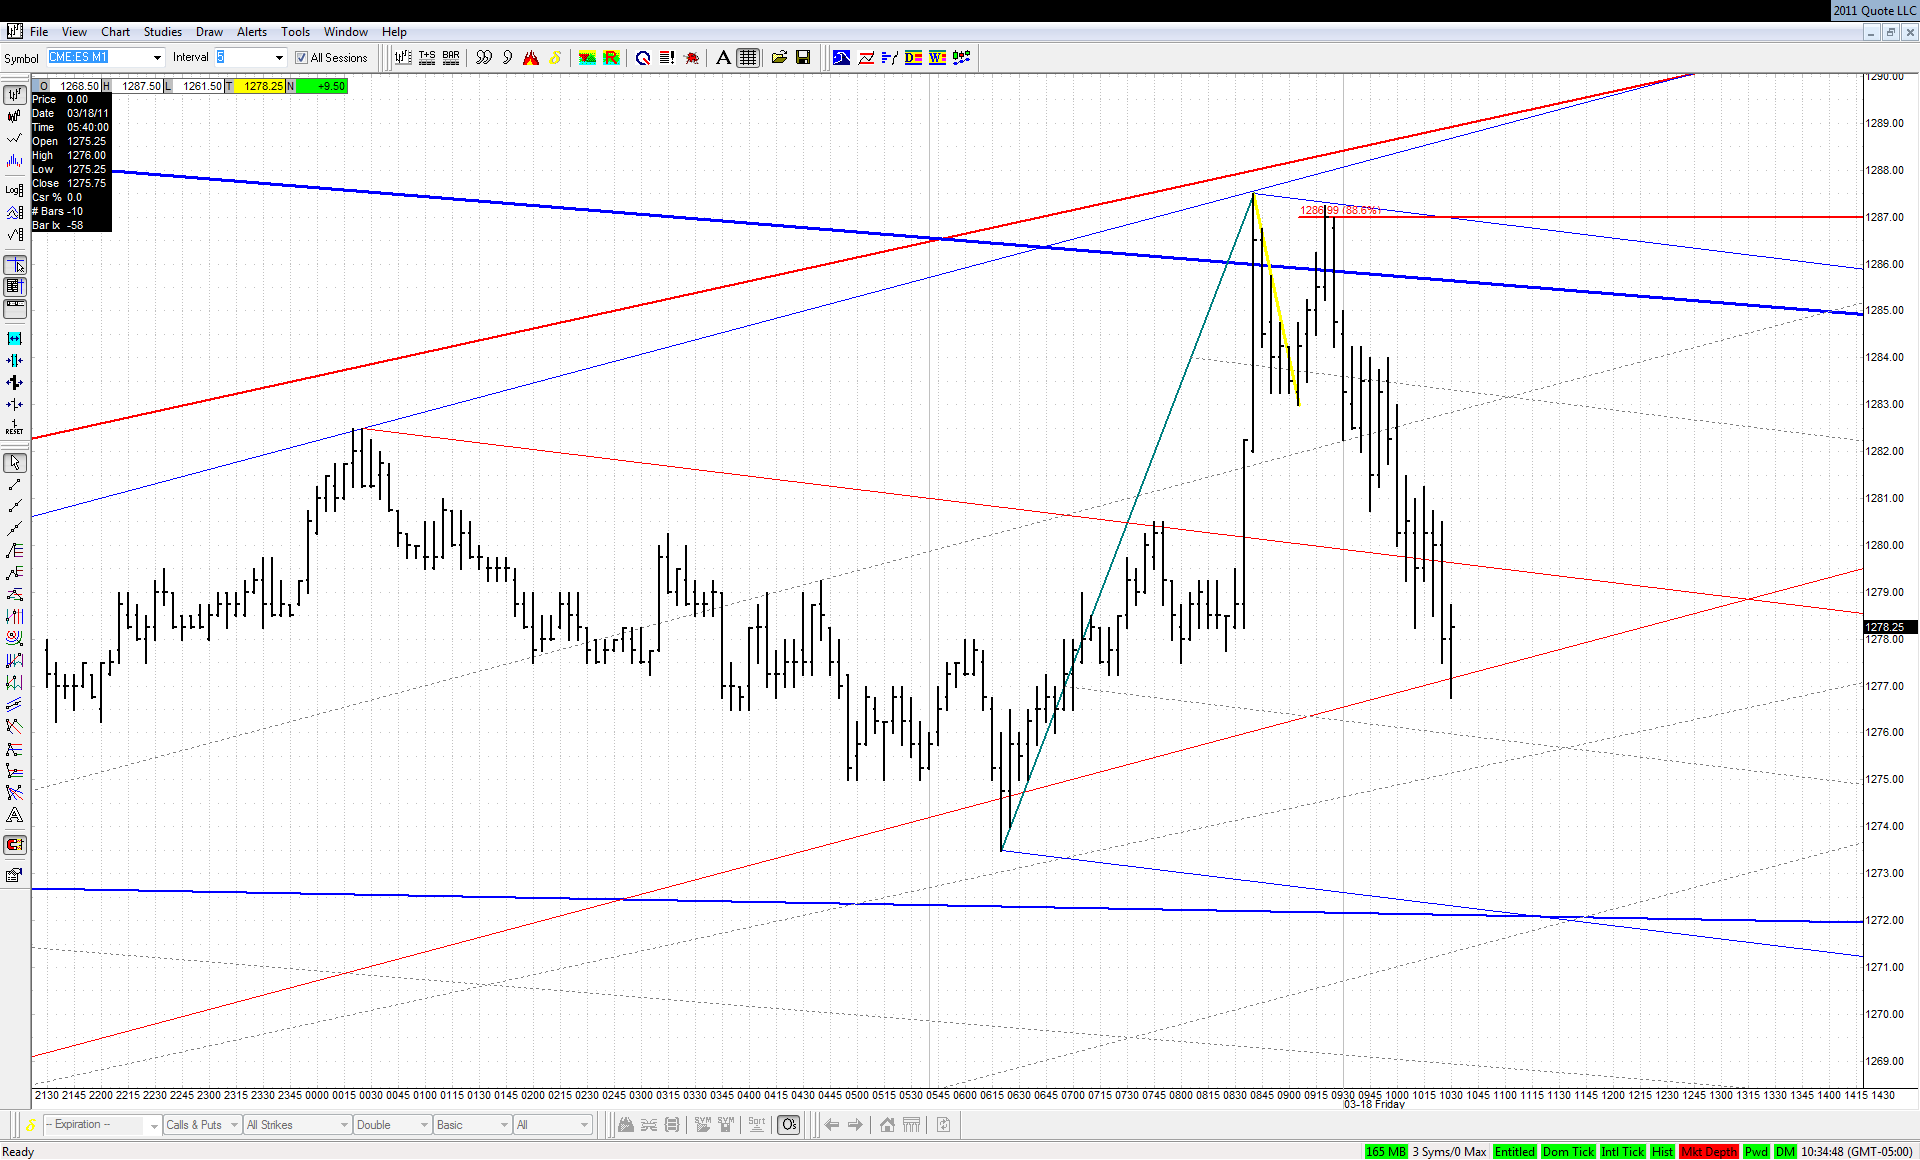
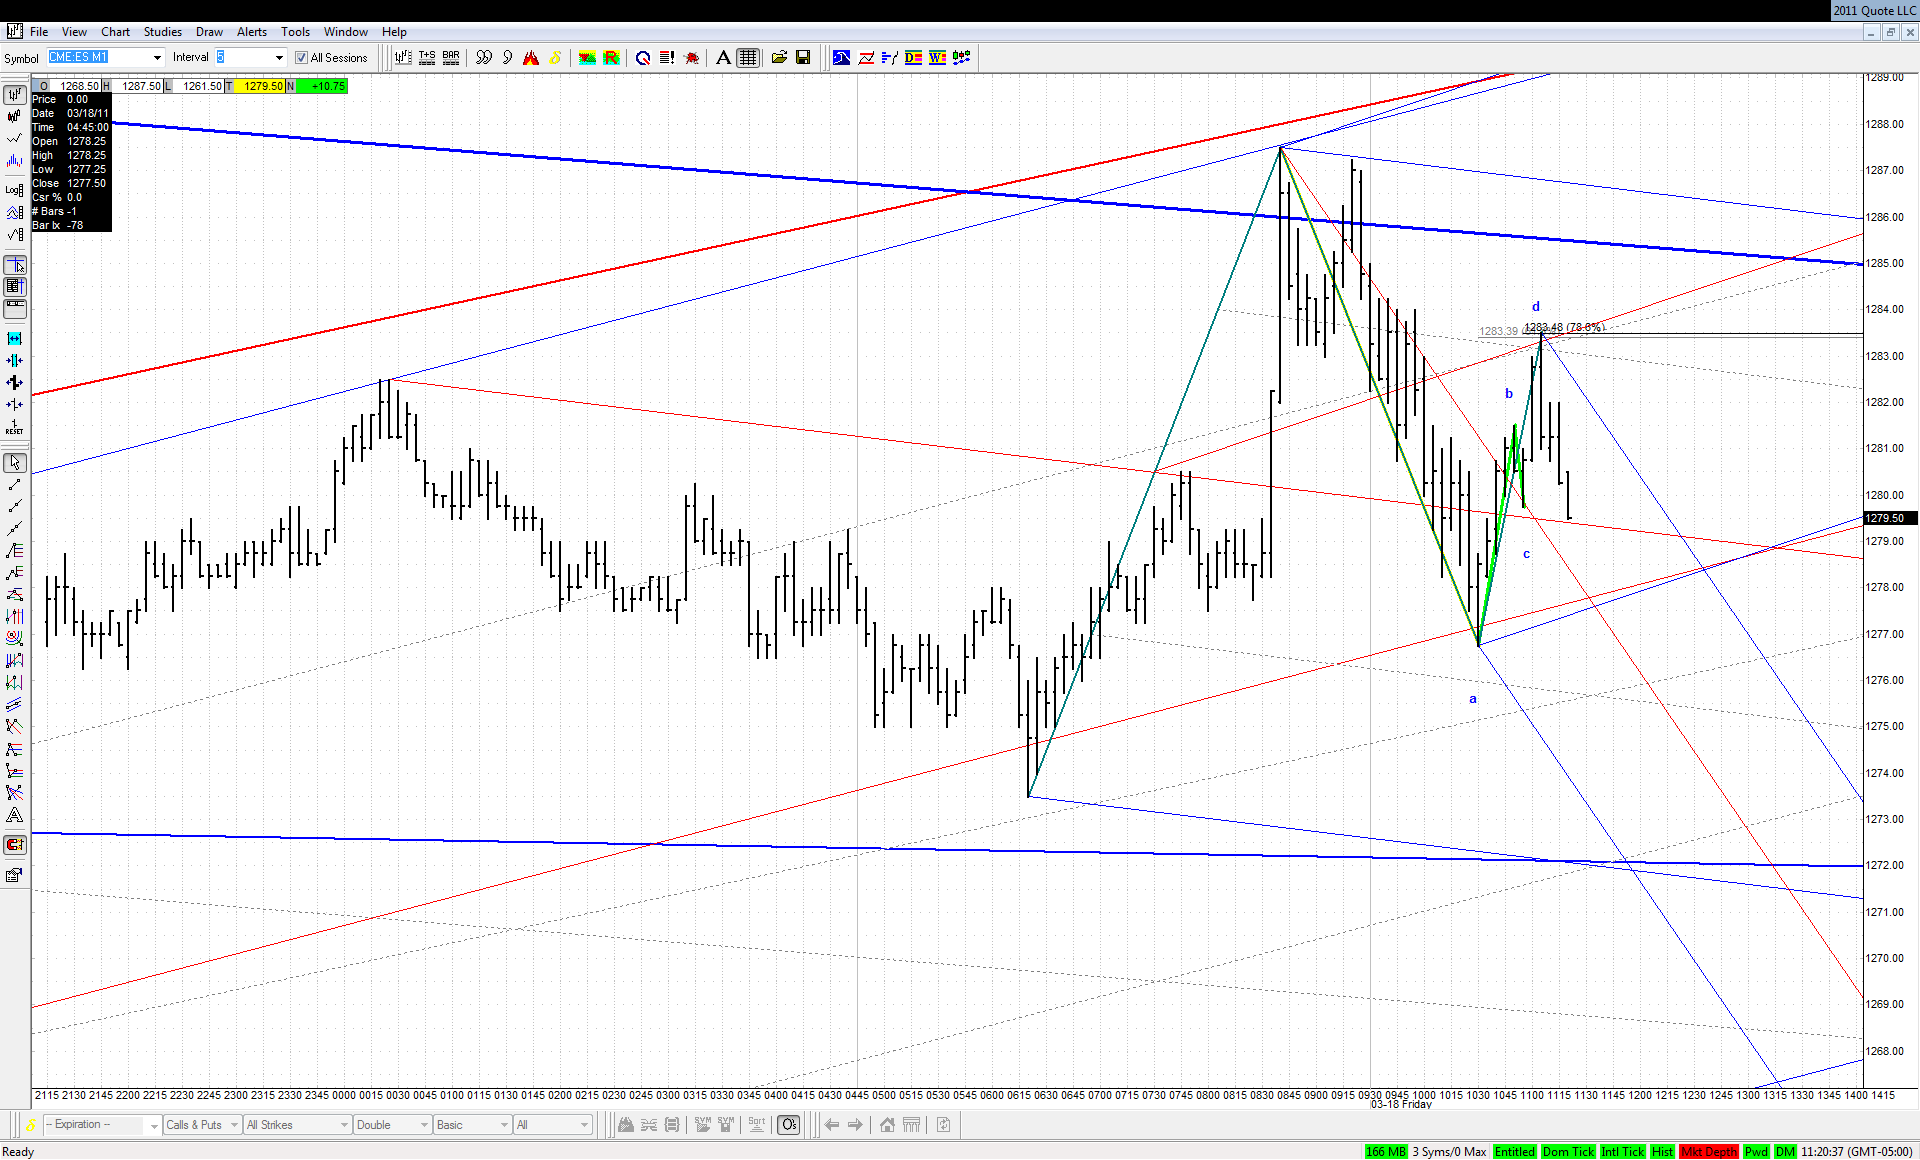
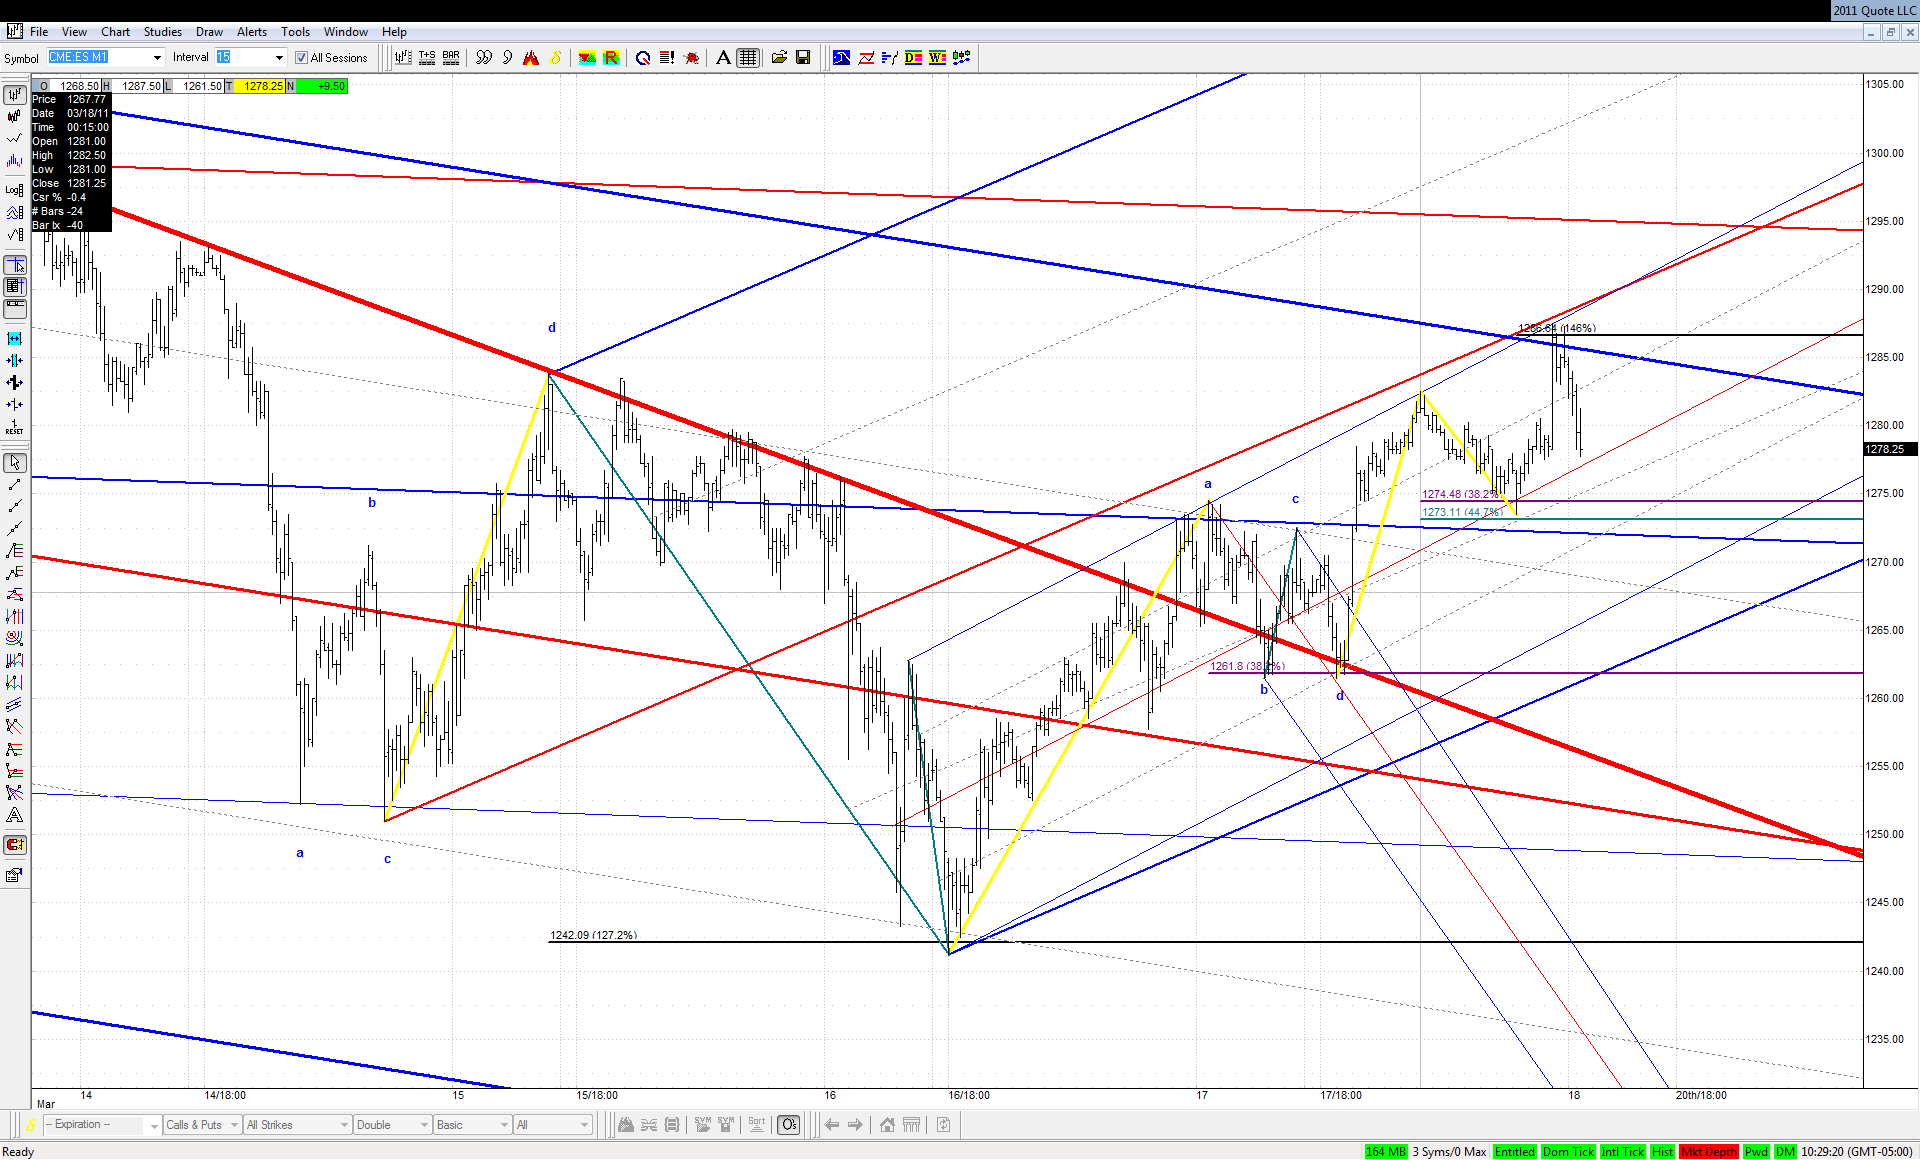
There is not much to add to the extensive coverage of the recent weeks here. While looking for geometry of Friday's turn on the continuous contract basis I came up with the following picture:

Click image for original size
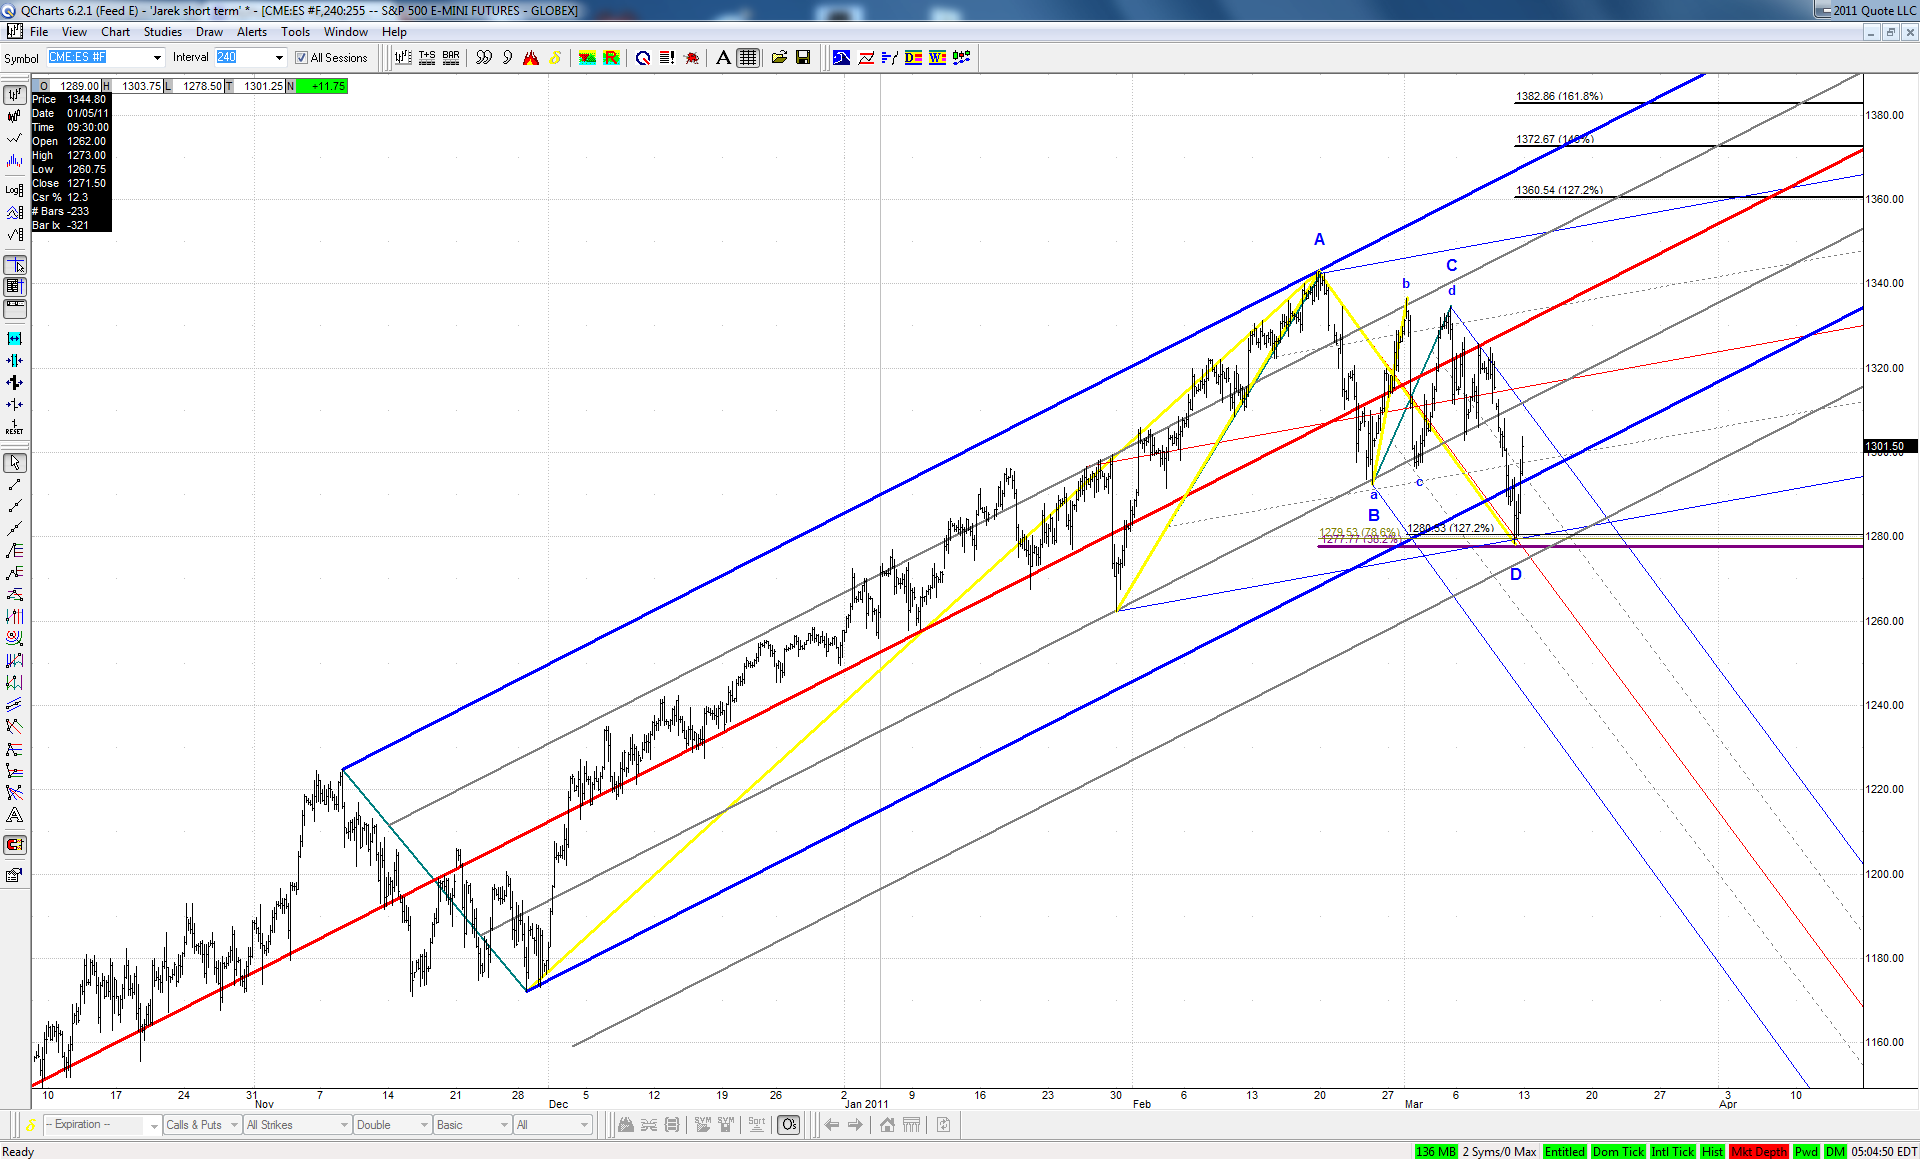

We have an almost ideal .382 bullish ABCD here. Thanks to Roofer's findings based on thousands of examples we know that probability of taking out the high equals in such case 87%. What's more in order to hit Jim's target zone at the line, a pretty fast move would be required... We'll see next week if we are on the right track and ... in the right train
JA
jarek
Rep: 94
Posts: 3,474
On my short term chart this spot also looks very interesting...

Click image for original size
JA
jarek
Rep: 94
Posts: 3,474
... and the price started dropping heavily? Hmm...
JA
jarek
Rep: 94
Posts: 3,474
... and it started with .886 at a line?

Click image for original size
RA
rat89
Rep: 0
Posts: 7,015
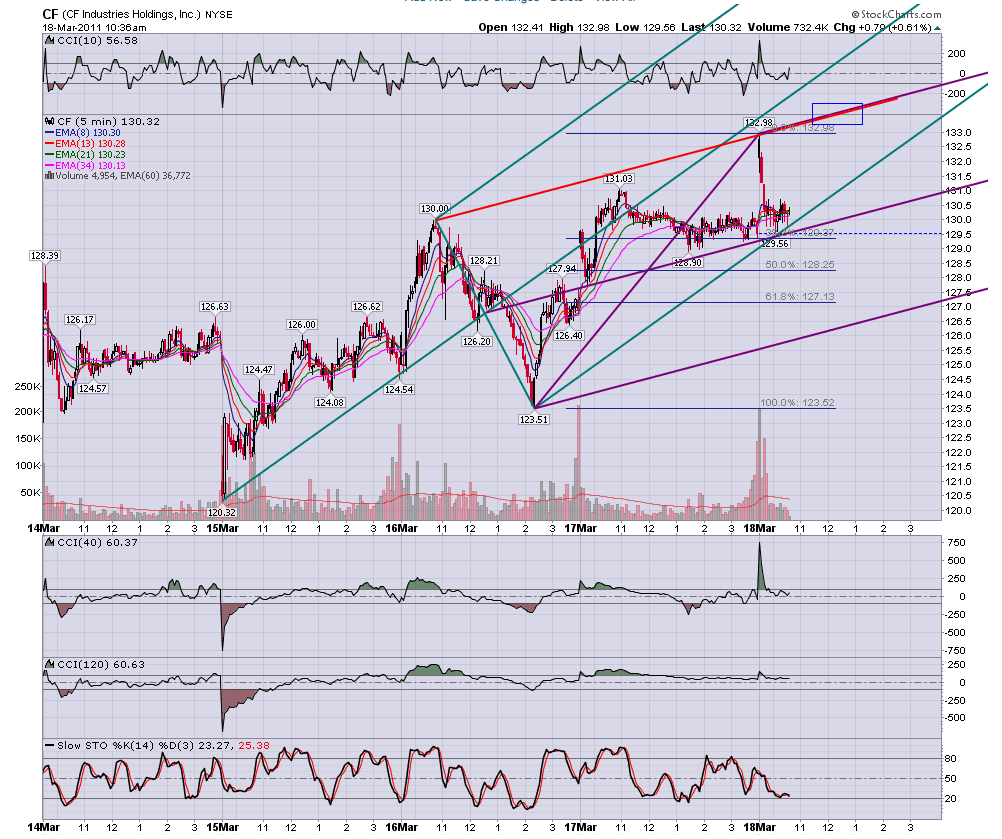
roofer got me curious...

??
Click image for original size
RA
rat89
Rep: 0
Posts: 7,015
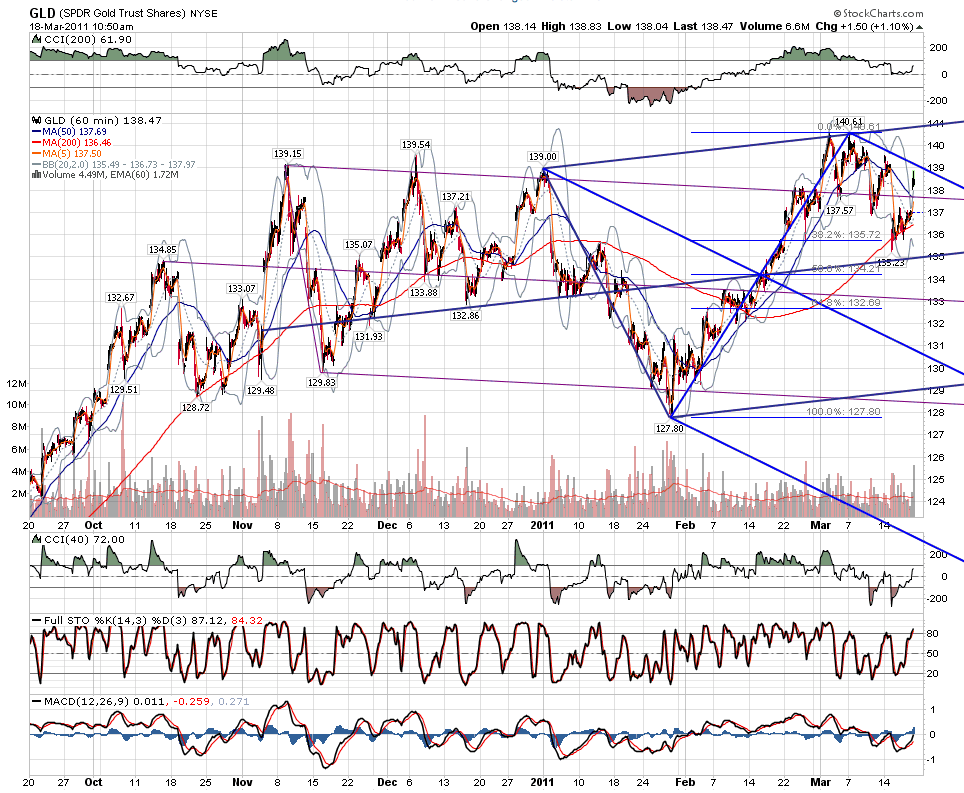
turned up in an interesting area.....wondering which line it's headed for.... 14000 = .886...... 139.08 is .886 last lower high..... 141.30 = 1.128 at the upper line....just thinking out loud...
Click image for original size
JA
jarek
Rep: 94
Posts: 3,474
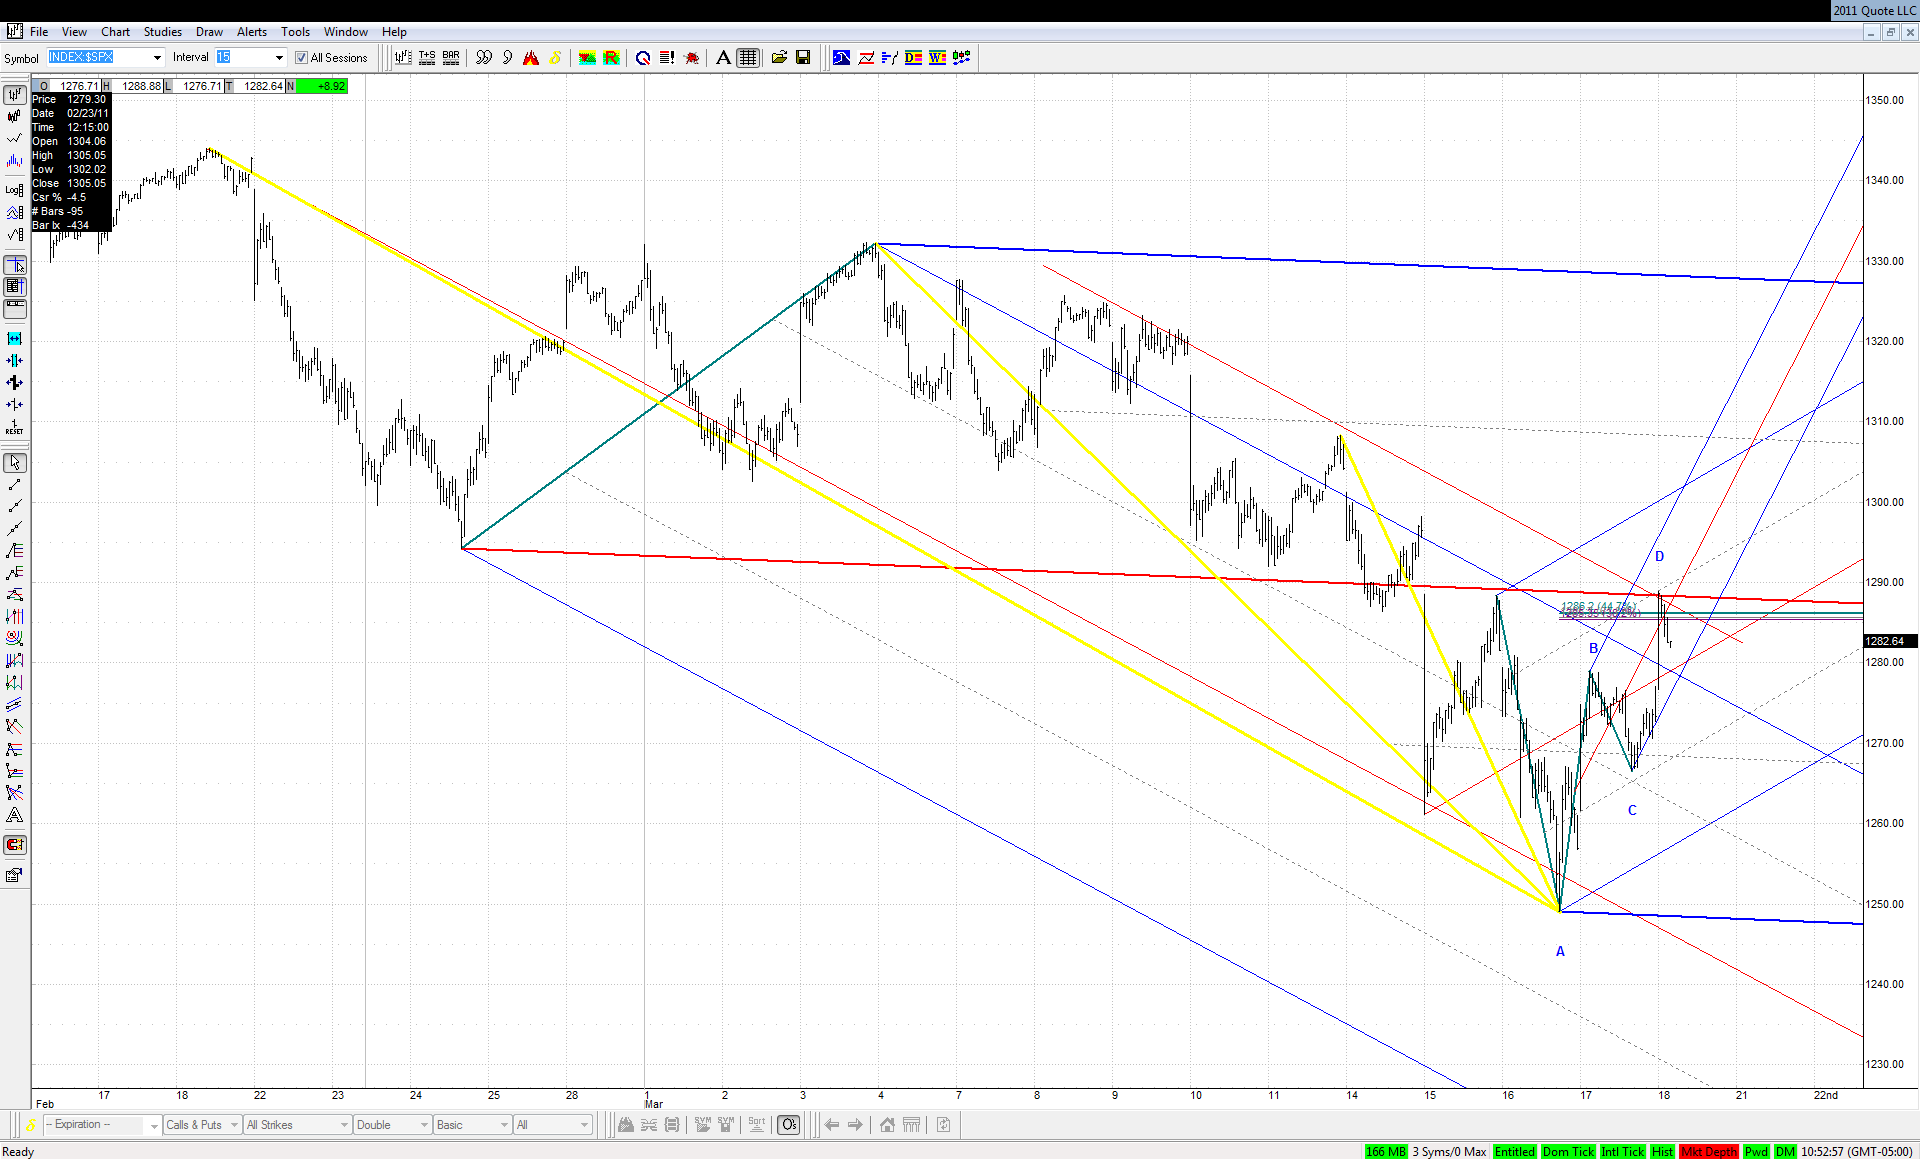
I rarely post $SPX, but this caught my eye:

Click image for original size
RA
rat89
Rep: 0
Posts: 7,015
you do have to wonder....

Originally posted by jarek

I rarely post $SPX, but this caught my eye:


Click image for original size

Click image for original size

Click image for original size
JA
jarek
Rep: 94
Posts: 3,474
This may start to look very seriously pretty soon:

Click image for original size
JA
jarek
Rep: 94
Posts: 3,474
... and it did

Click image for original size
RA
rat89
Rep: 0
Posts: 7,015
yet another abcd to .382 at 12887?

Originally posted by jarek

I rarely post $SPX, but this caught my eye:


Click image for original size
TX
tx_ches
Rep: -10
Posts: 514
Practice work. I consolidated what Jarek did on the ES 15 minute chart. I'm only showing the last 2 days -- from where I left off on Wednesday.

Click image for original size