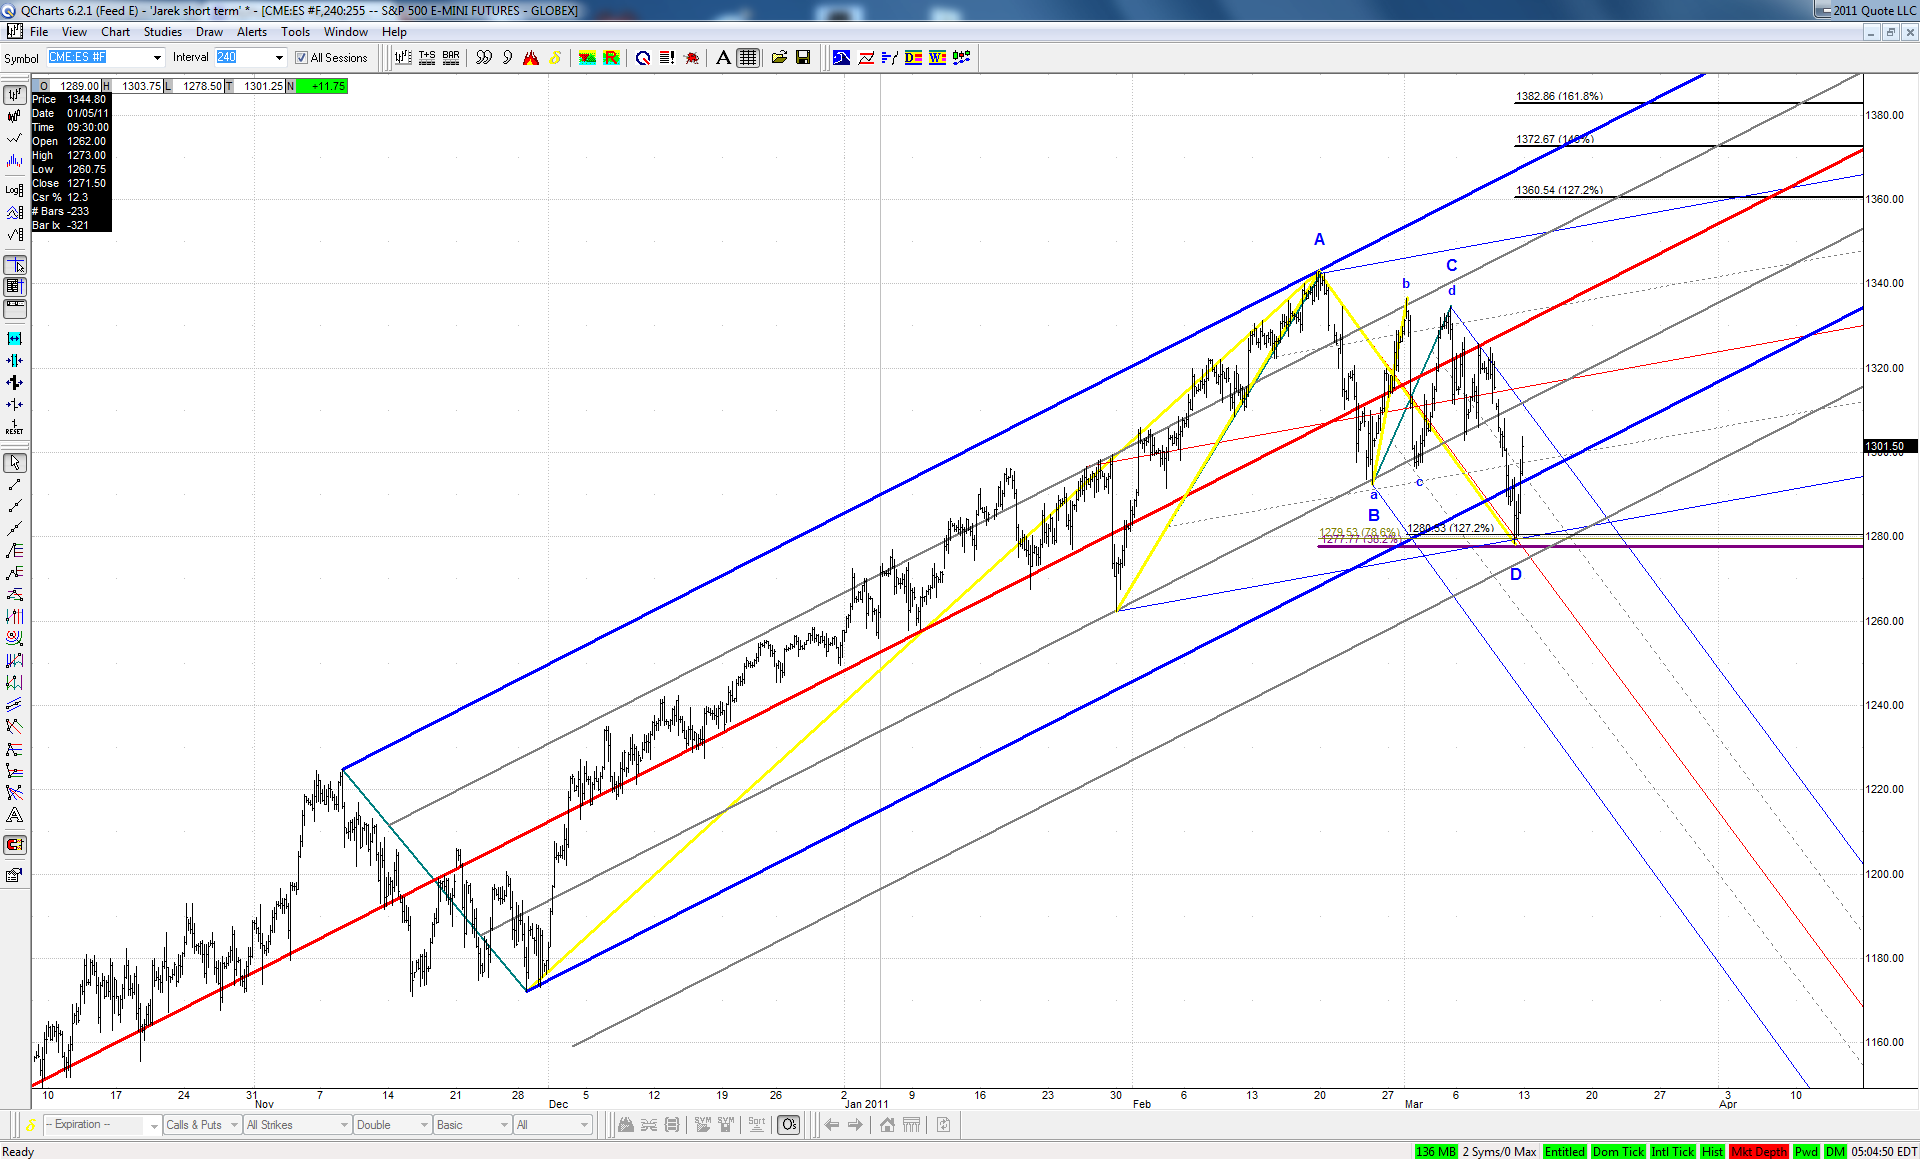
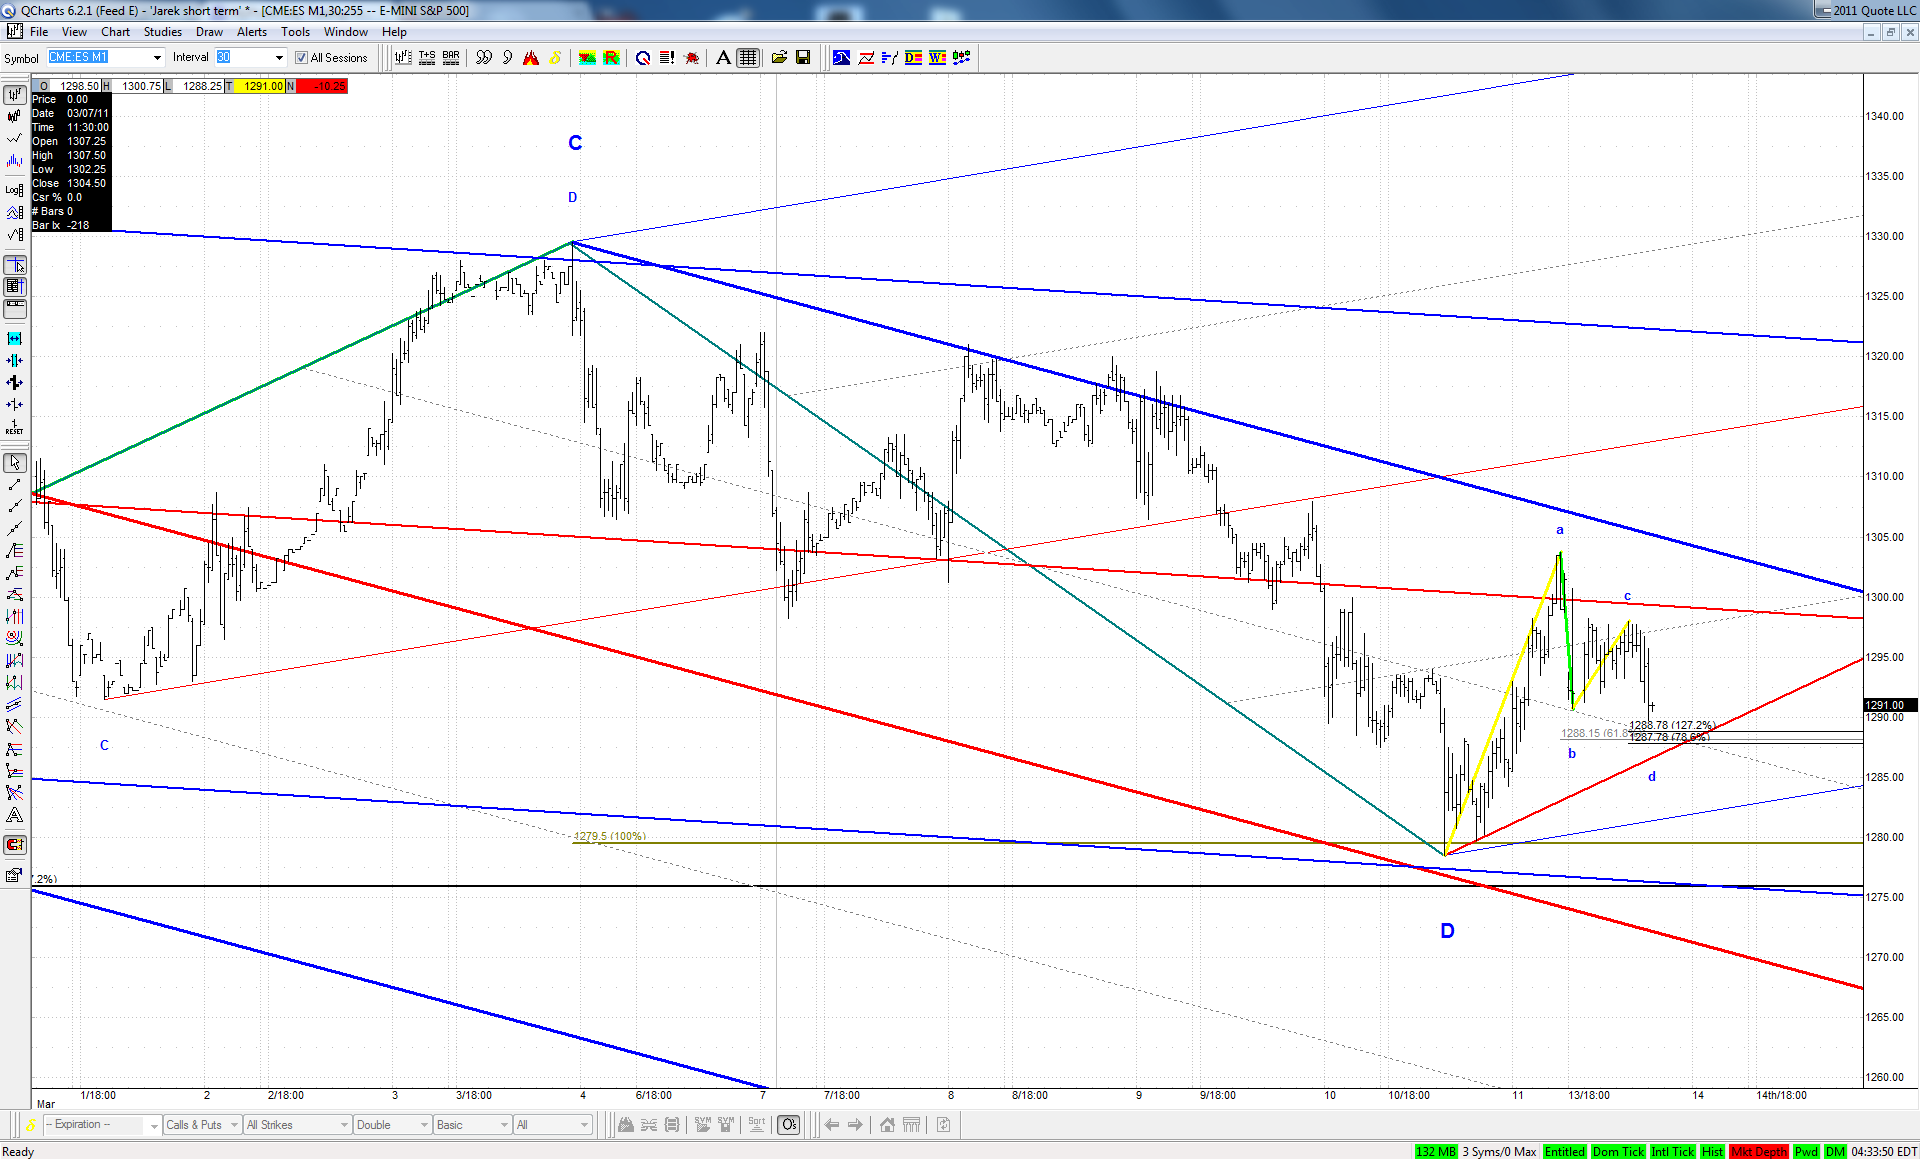
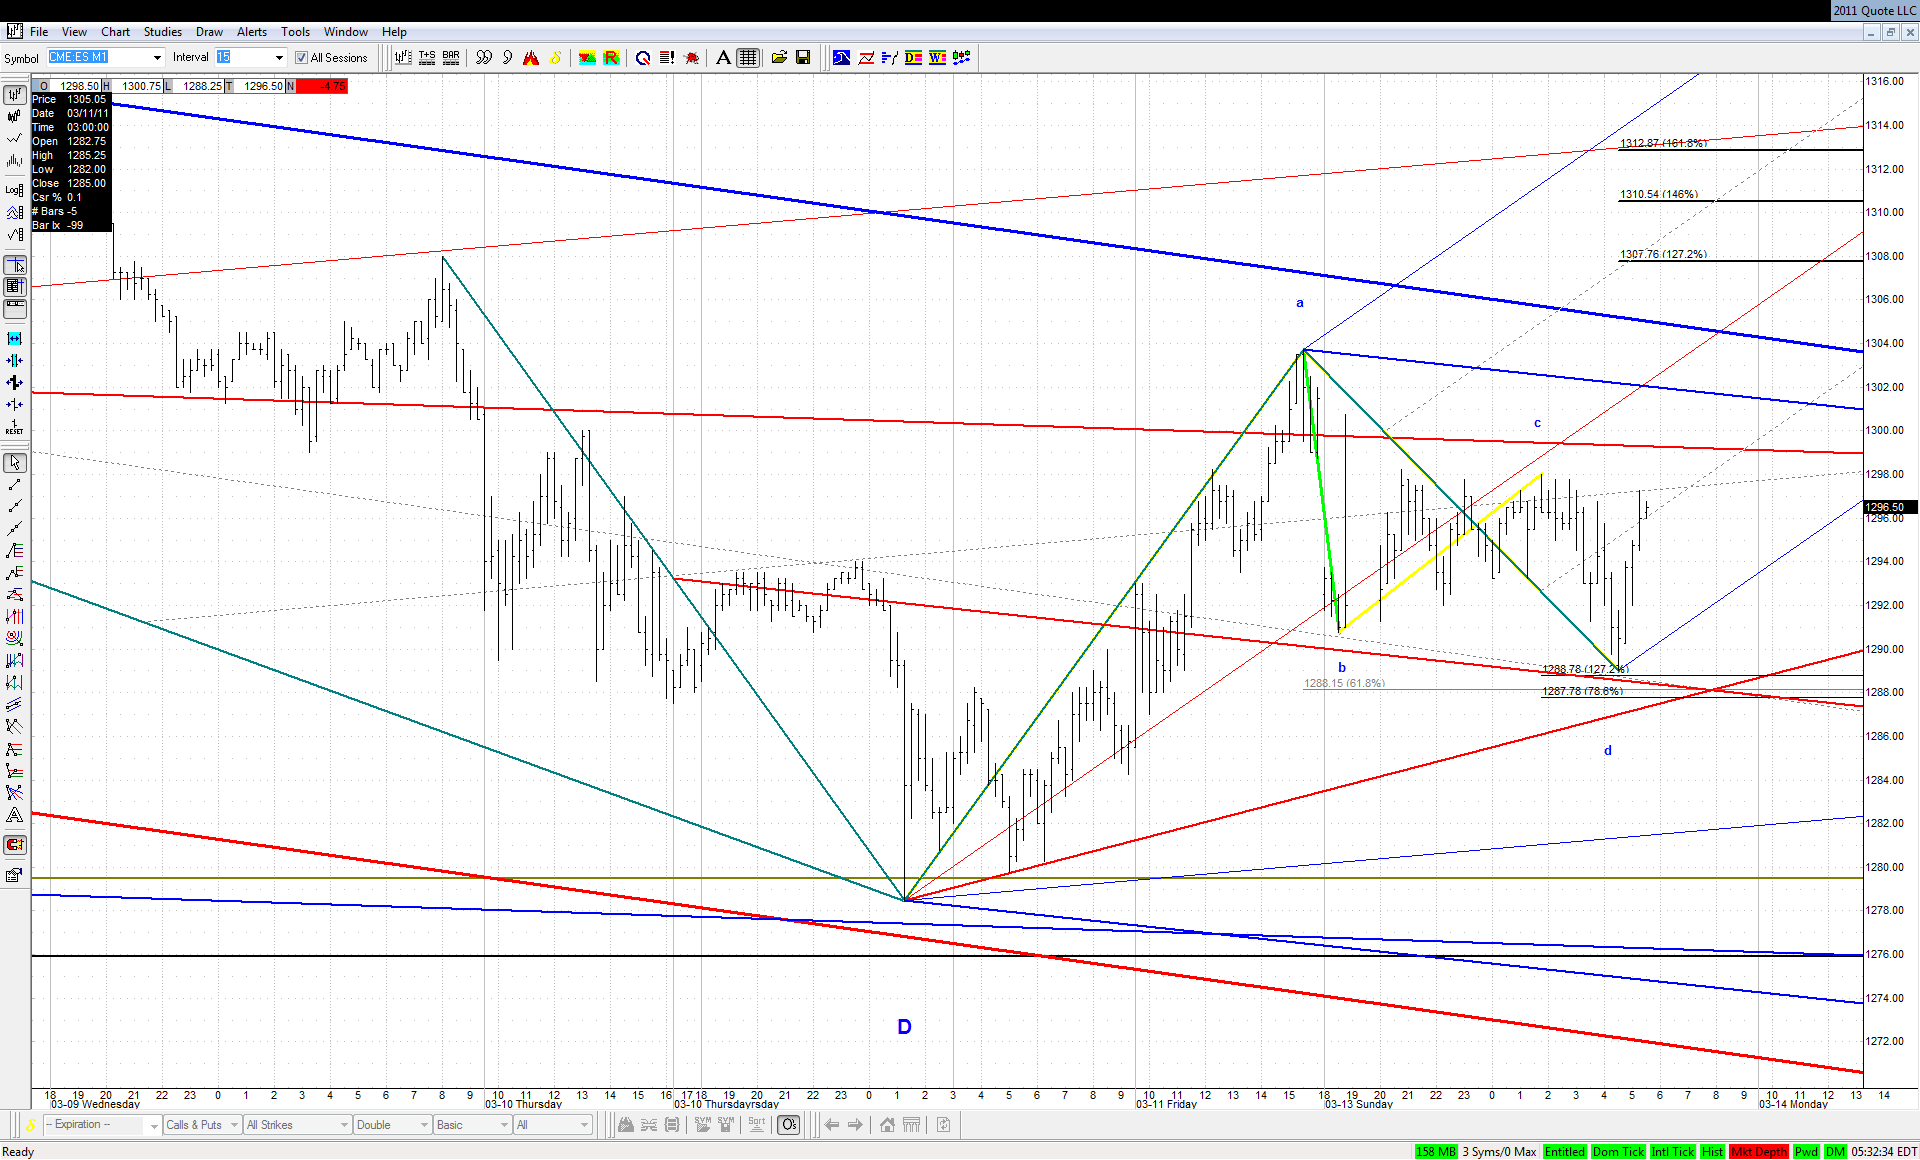
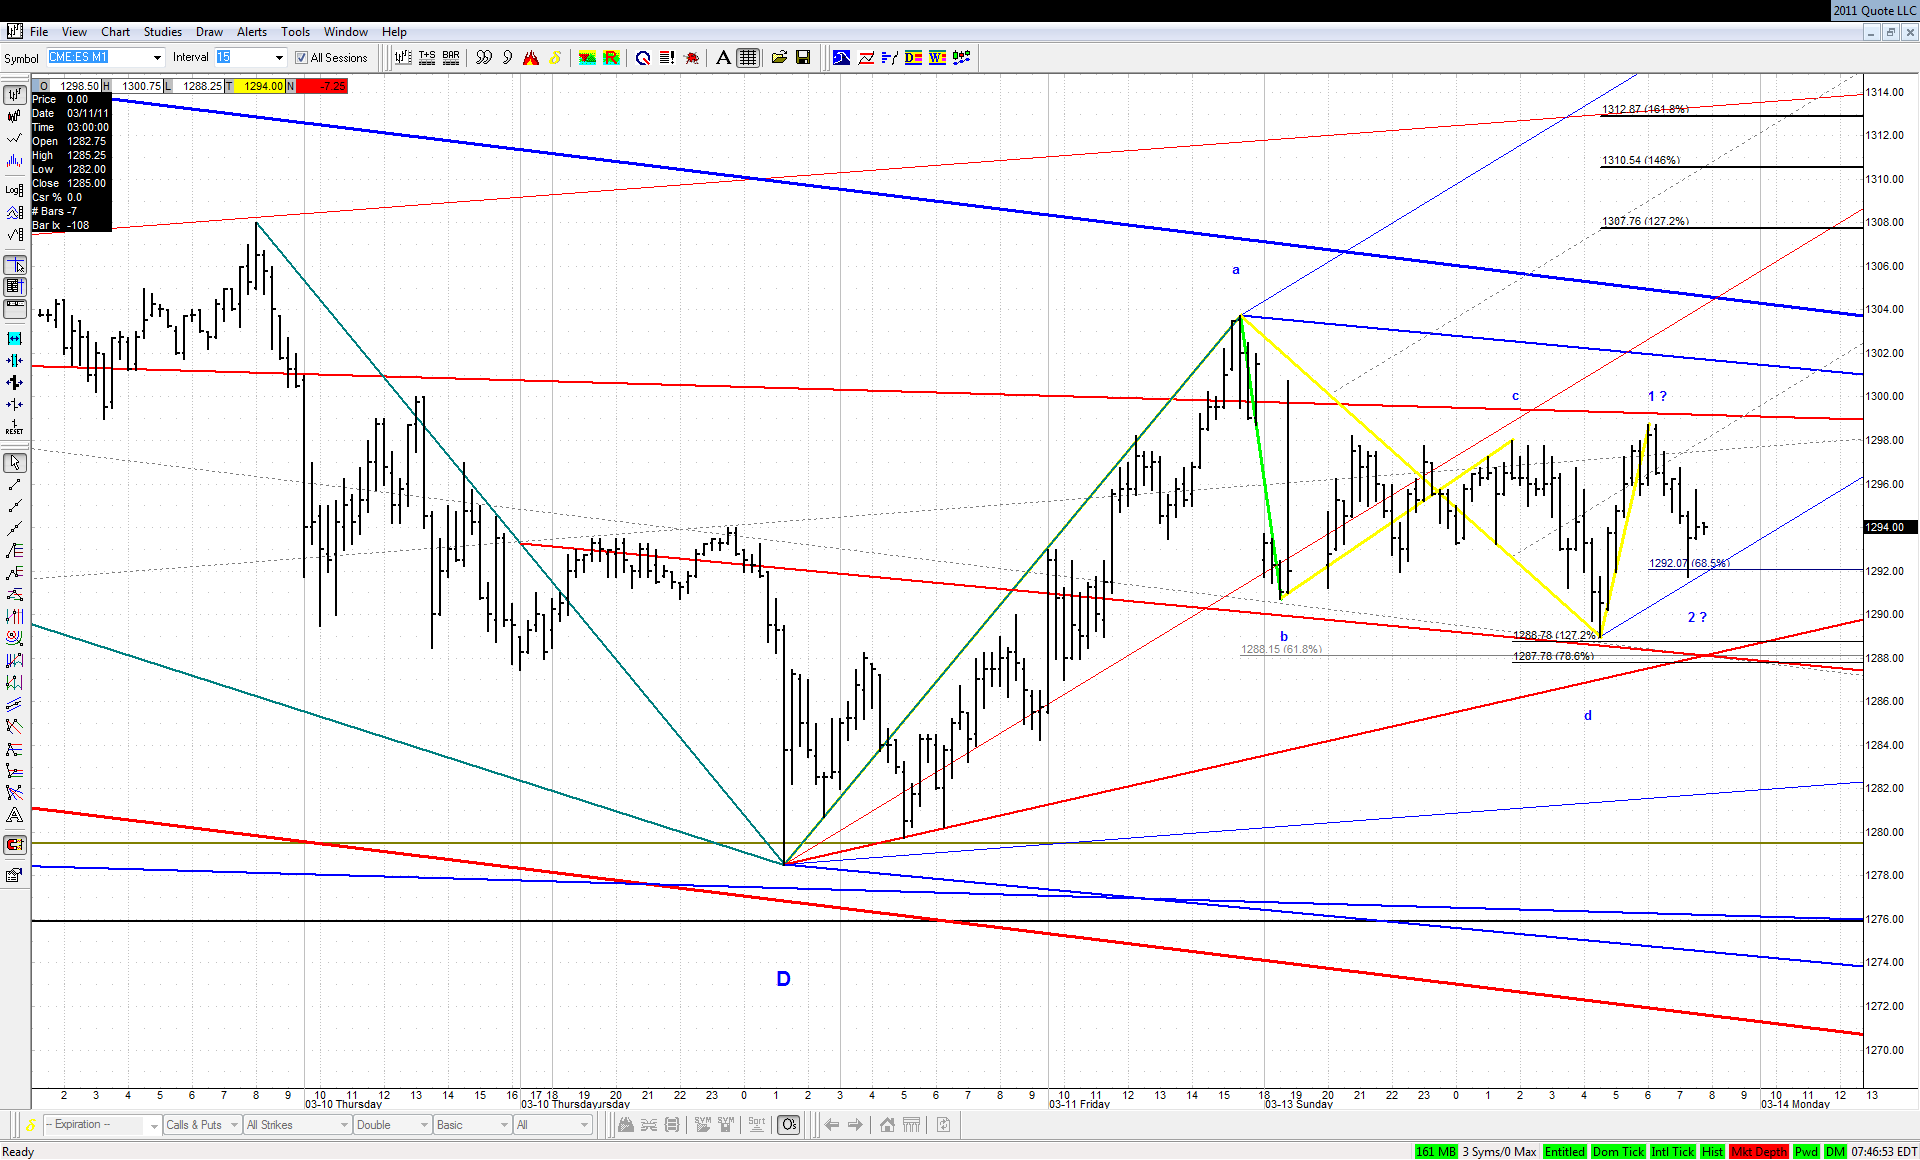
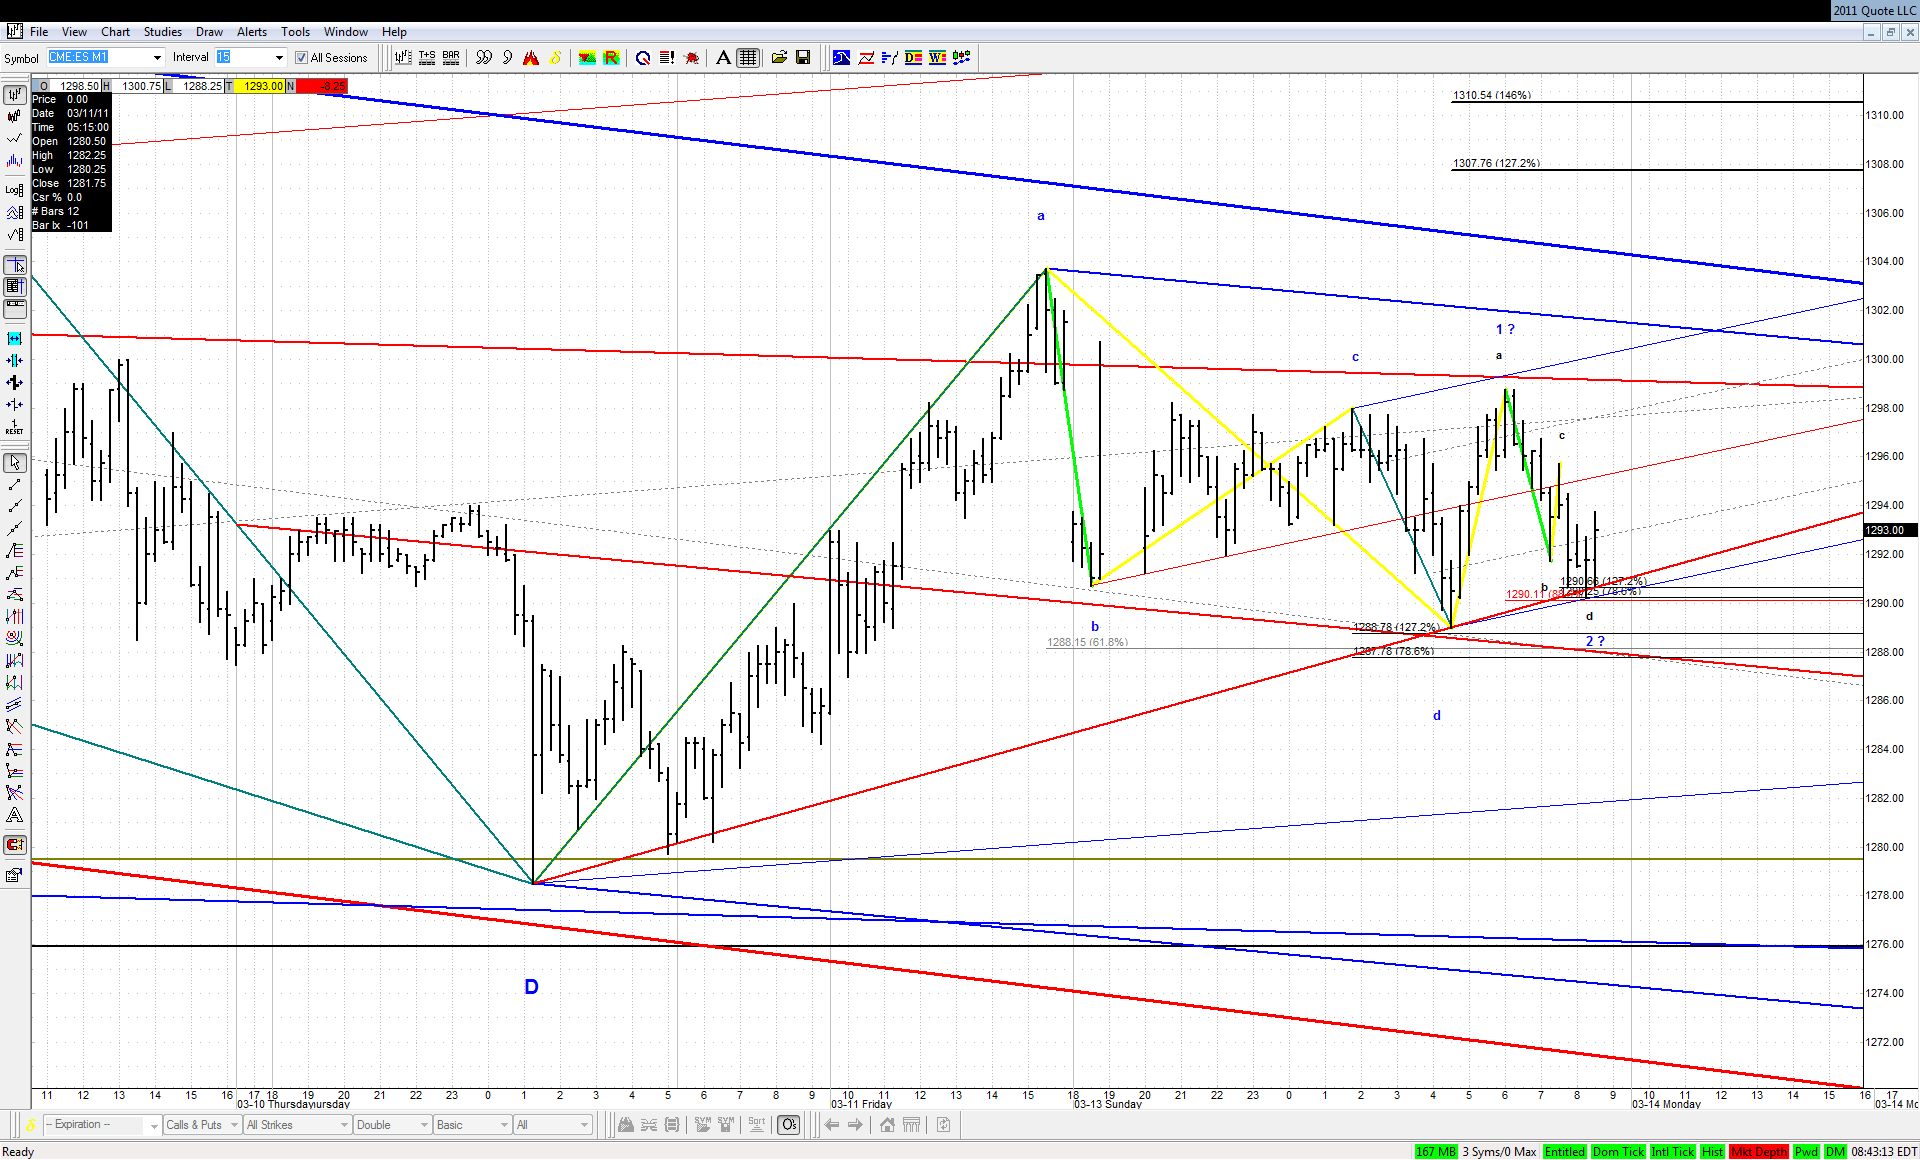
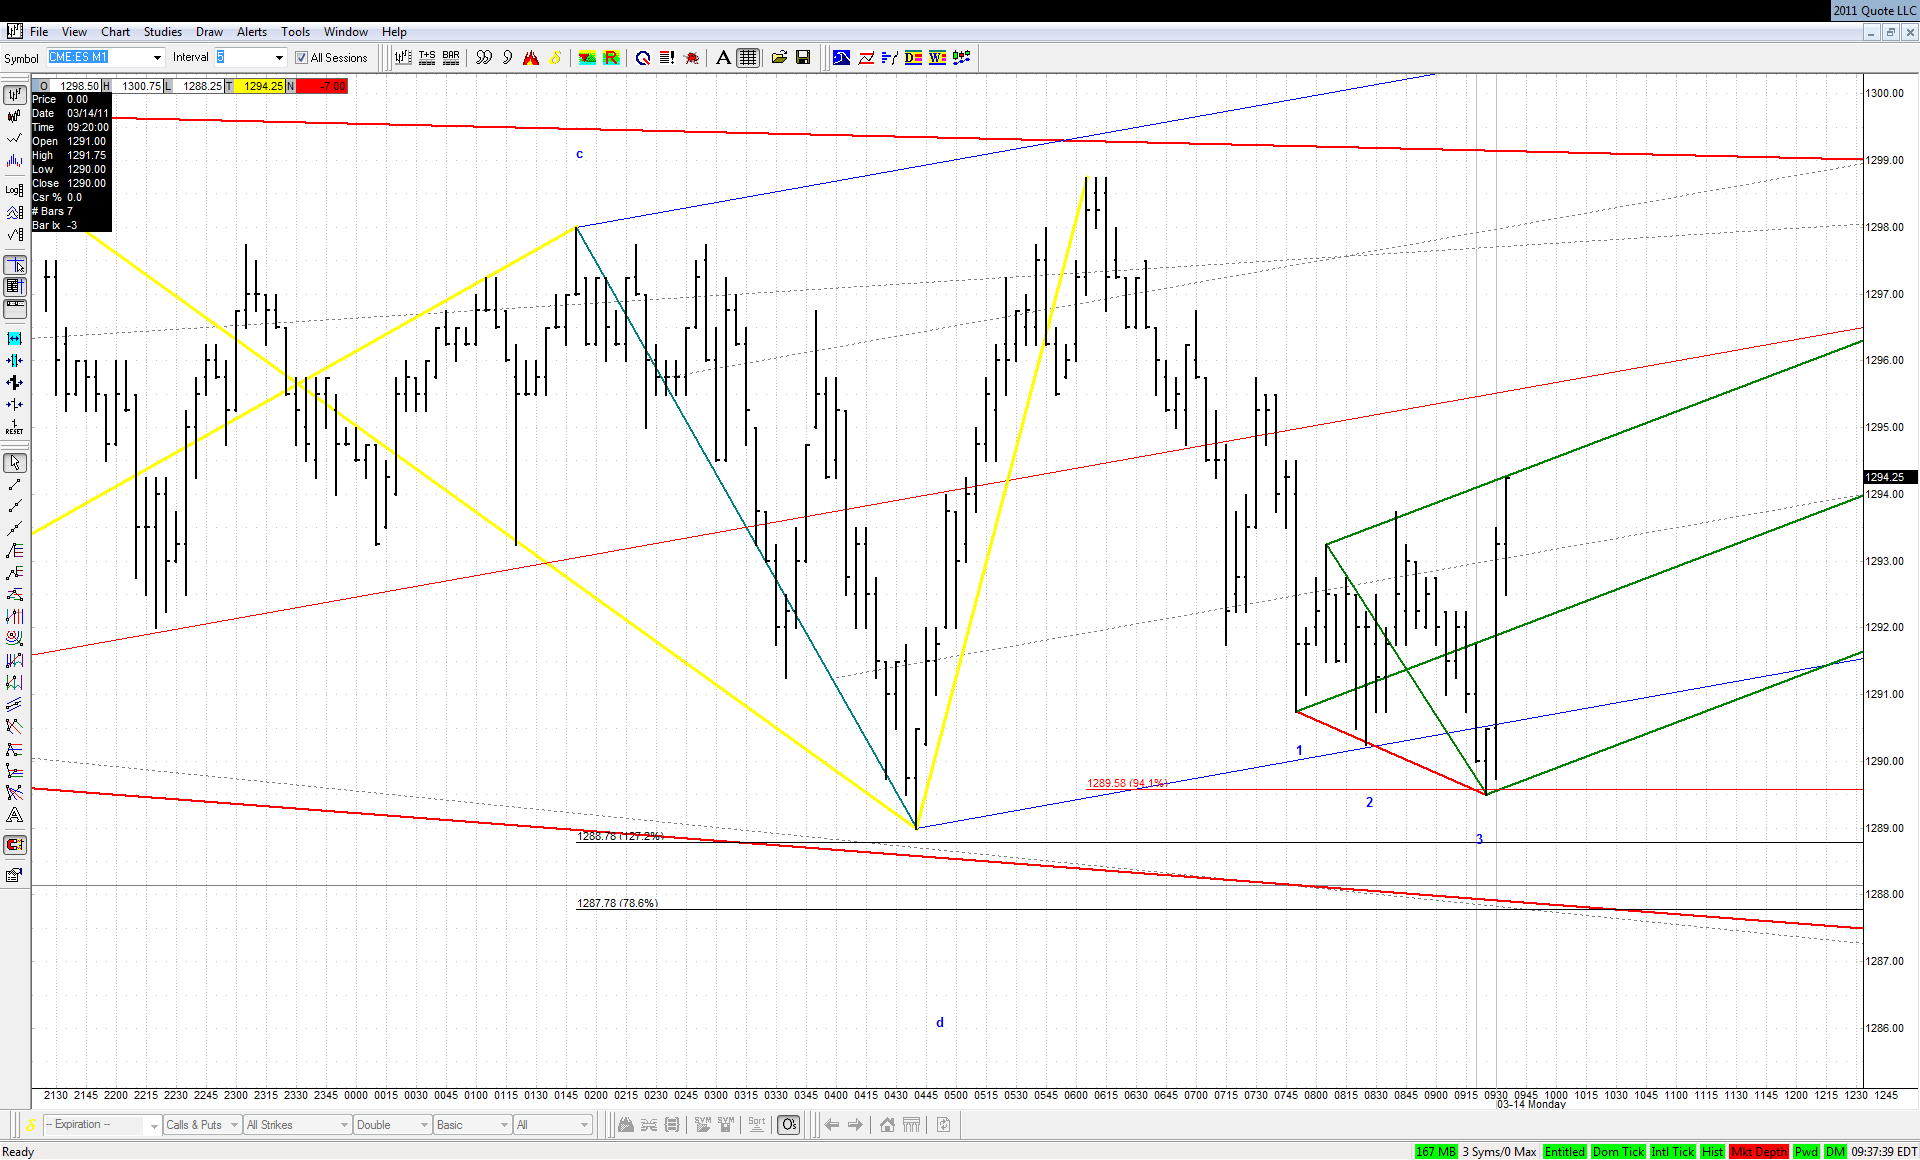
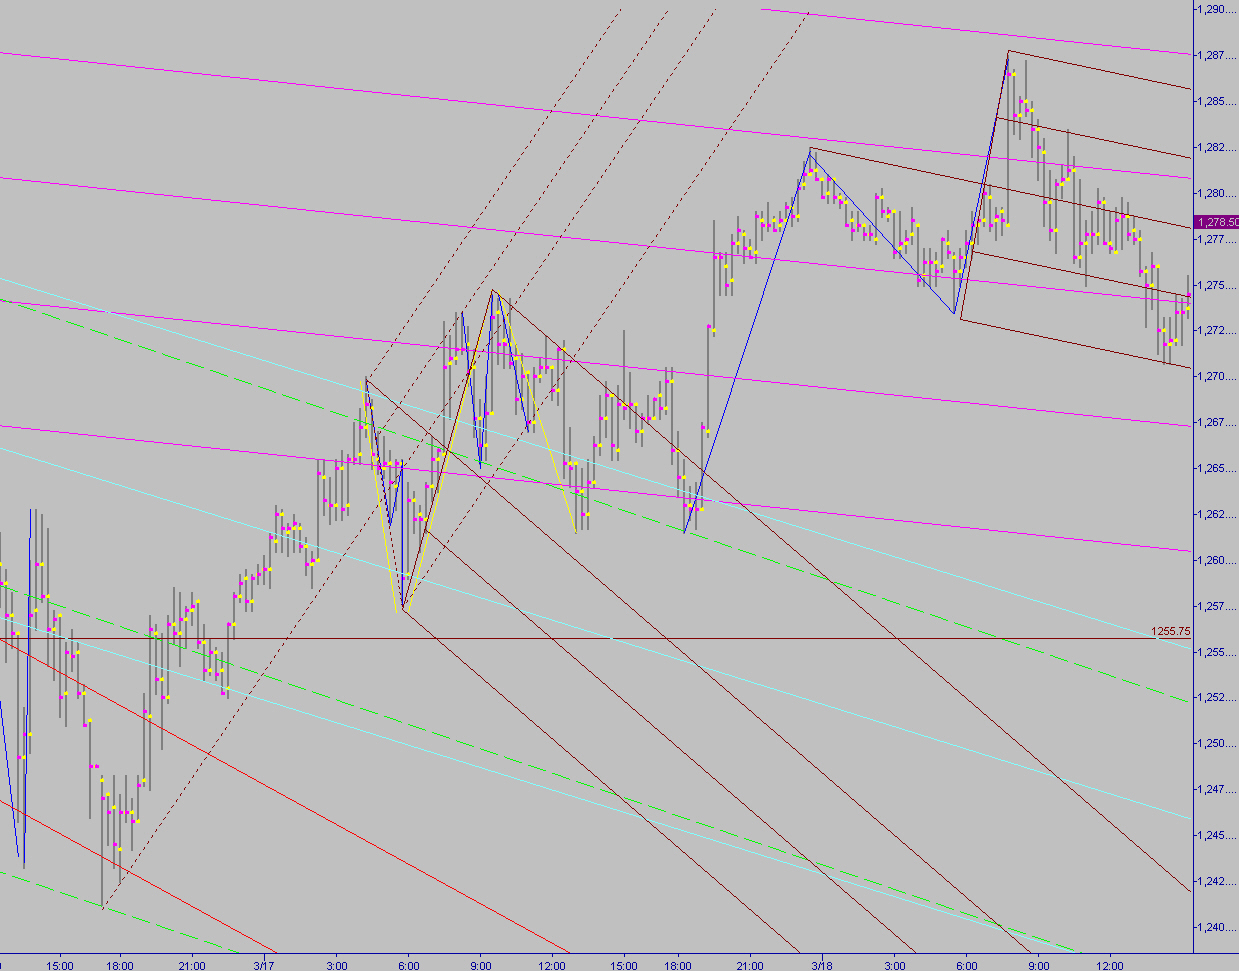
There is not much to add to the extensive coverage of the recent weeks here. While looking for geometry of Friday's turn on the continuous contract basis I came up with the following picture:
We have an almost ideal .382 bullish ABCD here. Thanks to Roofer's findings based on thousands of examples we know that probability of taking out the high equals in such case 87%. What's more in order to hit Jim's target zone at the line, a pretty fast move would be required... We'll see next week if we are on the right track and ... in the right train
RO
roofer
Rep: 3,689
Posts: 3,574
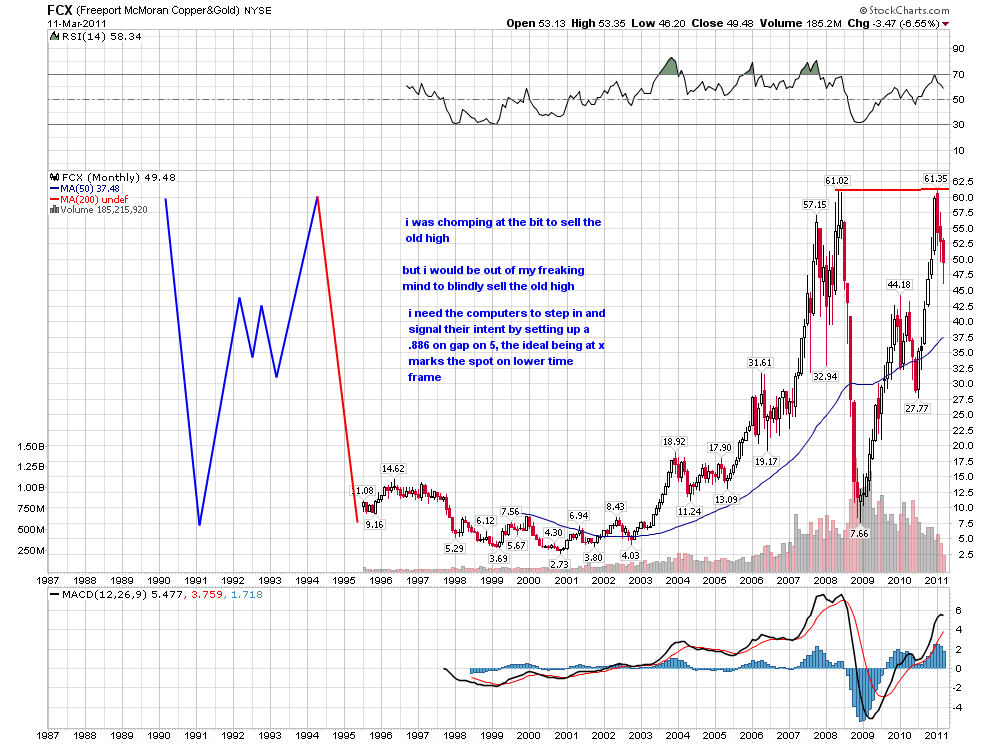
i think of the geometry of this chart everyday... how it is setup for massive c wave down... how it did in fact break off the top at .886 on 5 on gap....if you have read joed's post at his blog on gold and didn't understand let me translate.... the geometry for a turndown is in place, the alternaive is the completion of a measured move higher... the shorter term geometry says it must go now or a top is in place..... why on the week of its high was the CEO of GG everywhere on the tube touting his stock? why was the CEO of CDE TROTTED OUT TO TOUT HIS STOCK ON THE FLOOR OF NYSE AS HIS STOCK WAS SPIKING?
JA
jarek
Rep: 94
Posts: 3,474
Originally posted by roofer
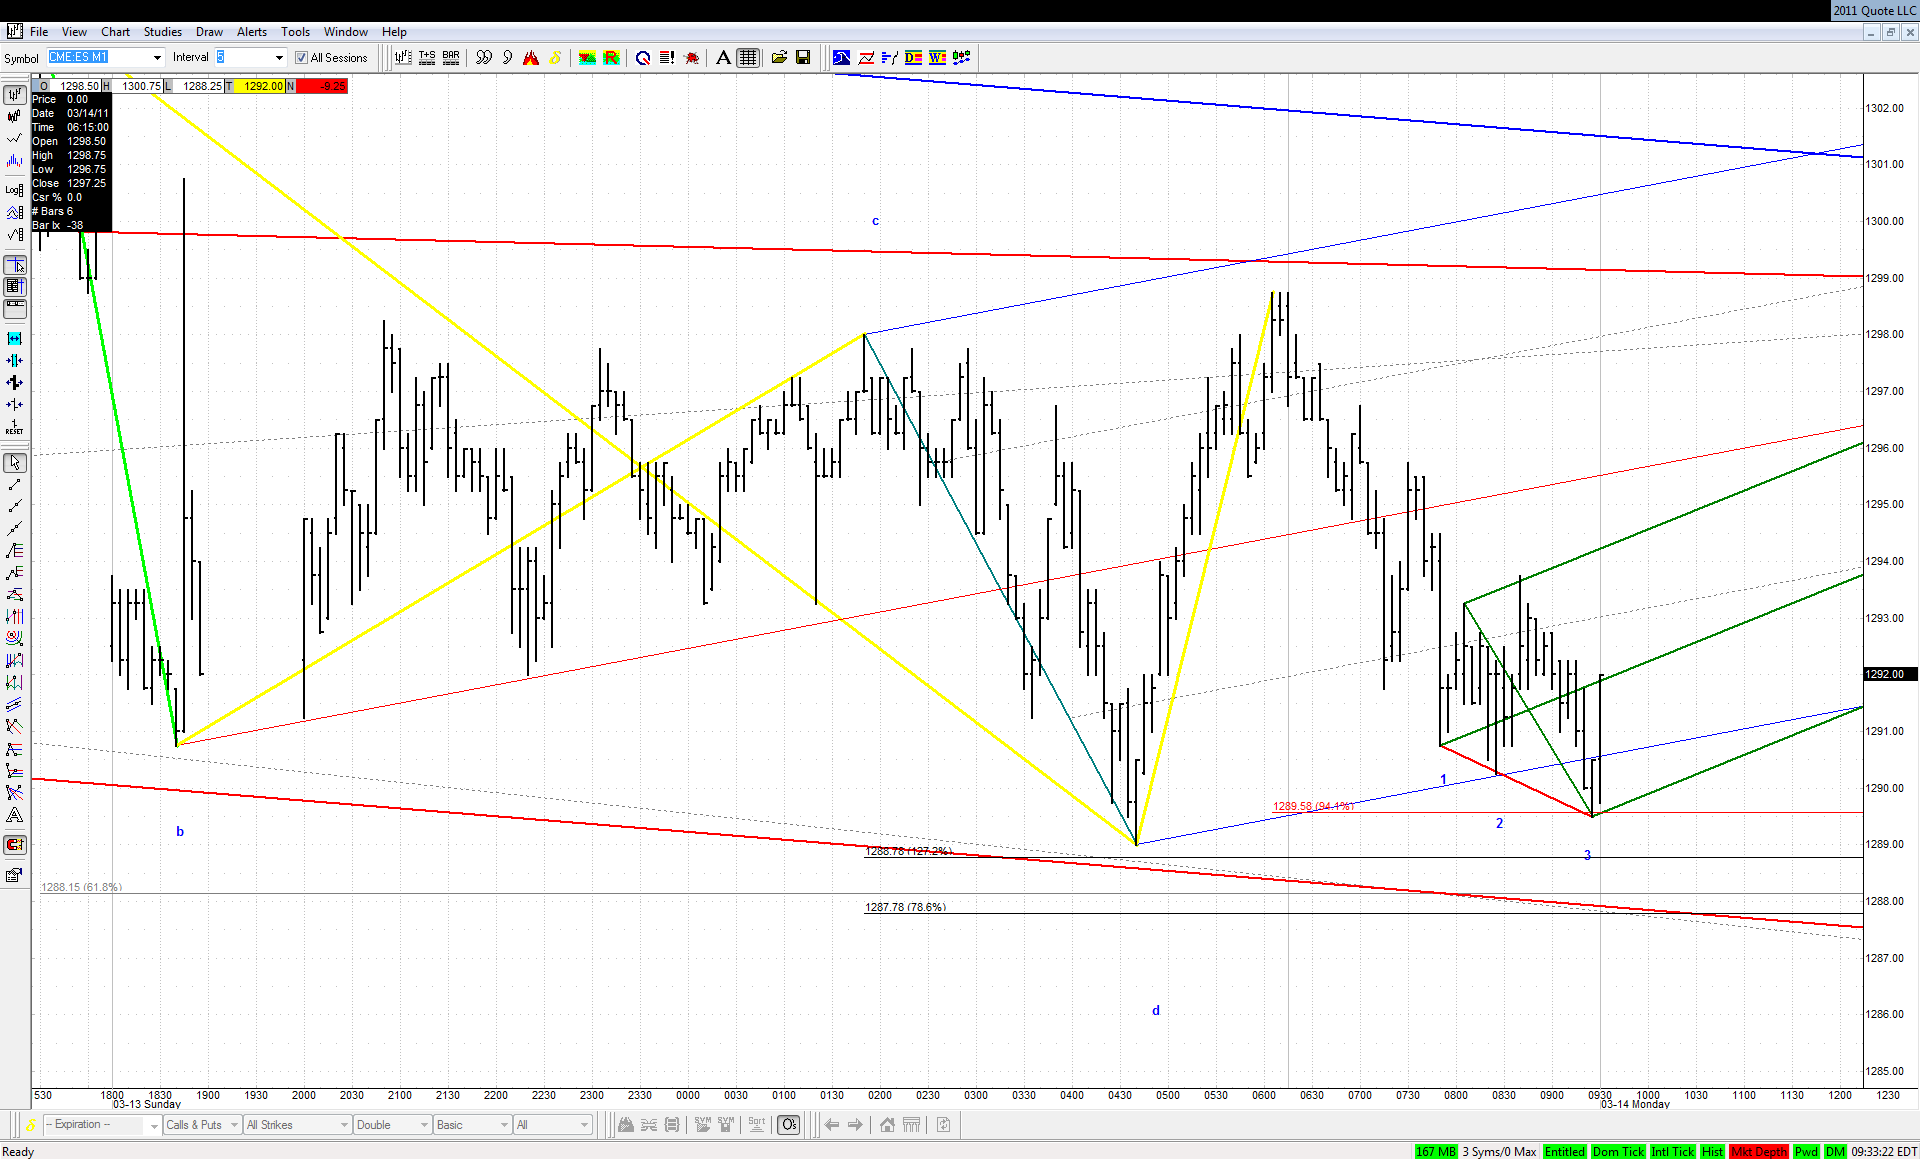
.. i see the chart you posted differently as a 1/2 with a 3rd wave down ahead...
I agree that if this .382 bullish ABCD fails - which is a low probability event - then we may see substantial selloff indeed.