MyPivots
Sign In
JA
jarek
Rep: 94
Posts: 3,474
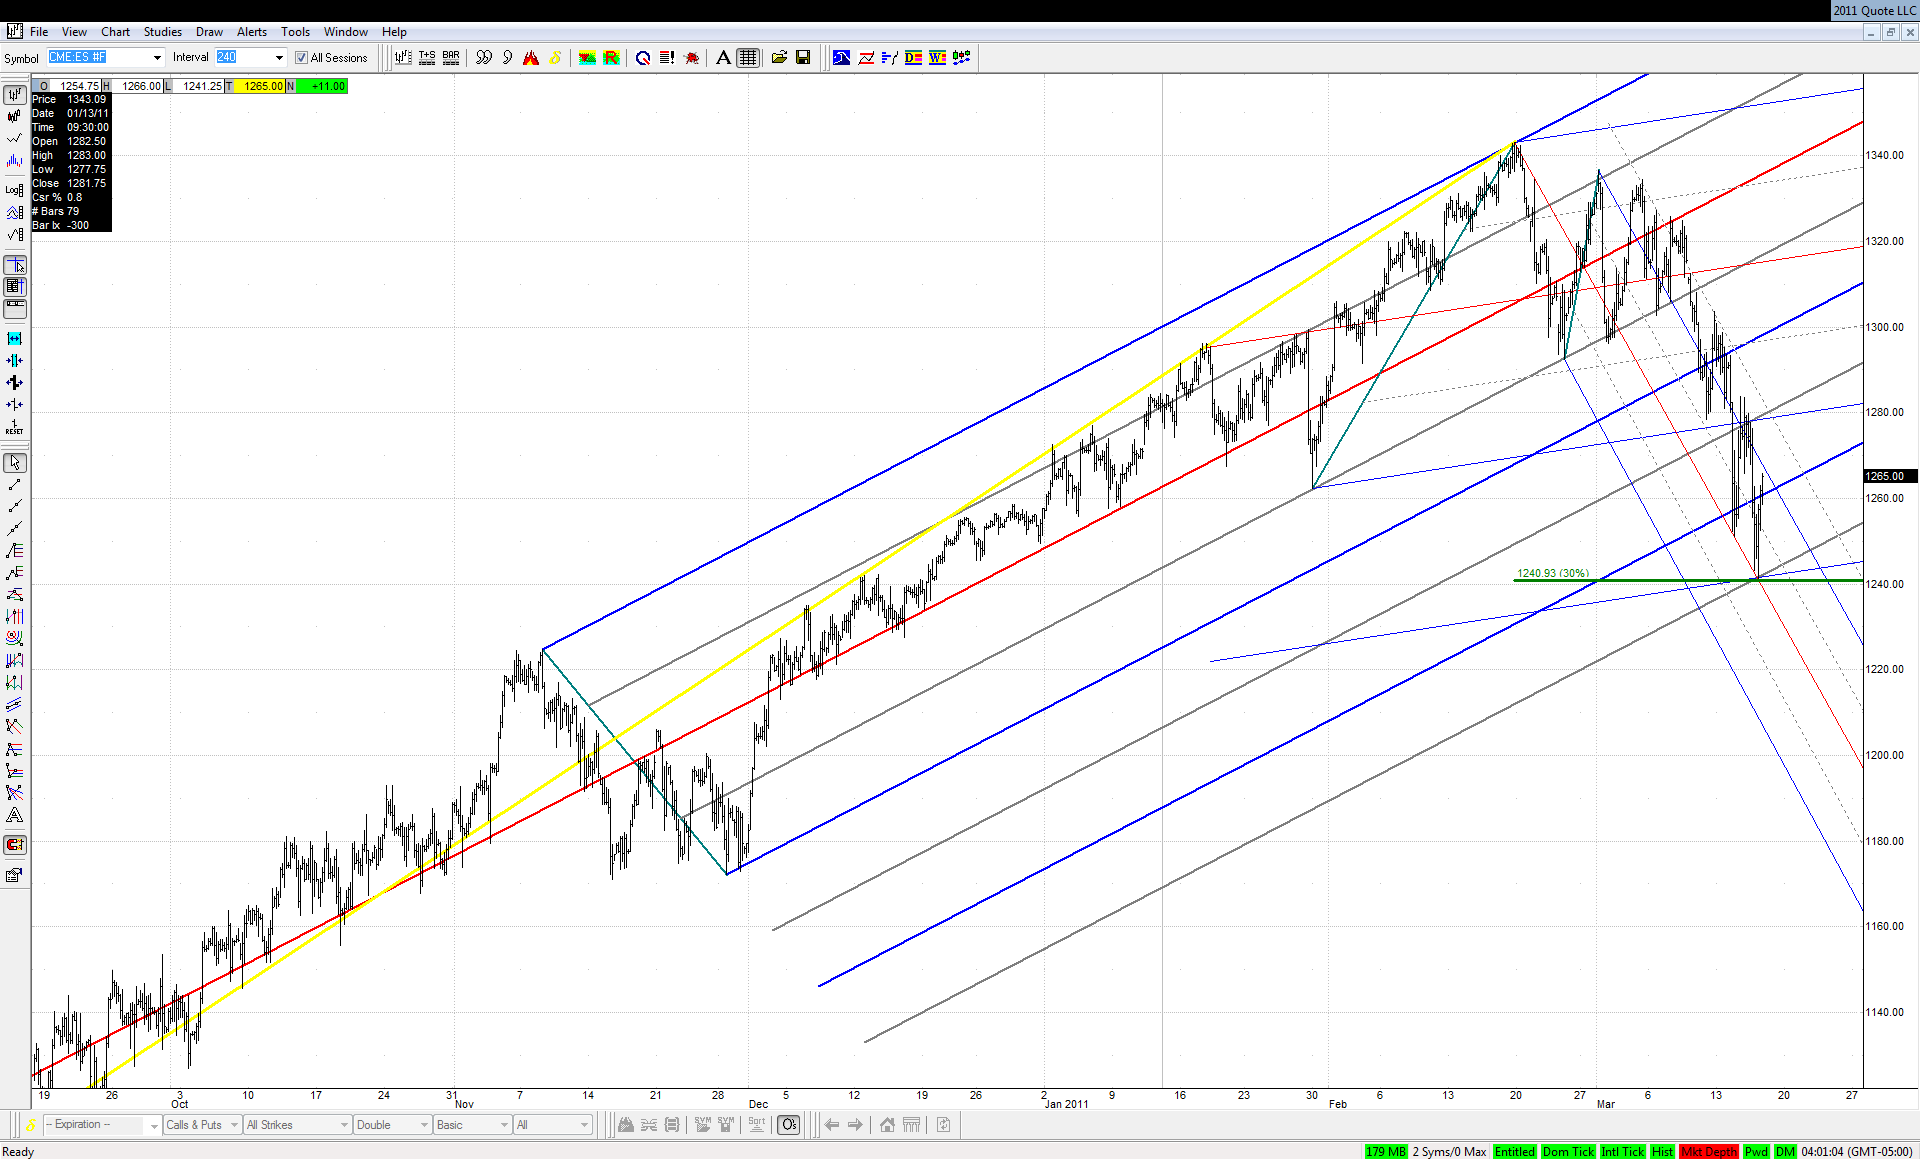
There is not much to add to the extensive coverage of the recent weeks here. While looking for geometry of Friday's turn on the continuous contract basis I came up with the following picture:

Click image for original size
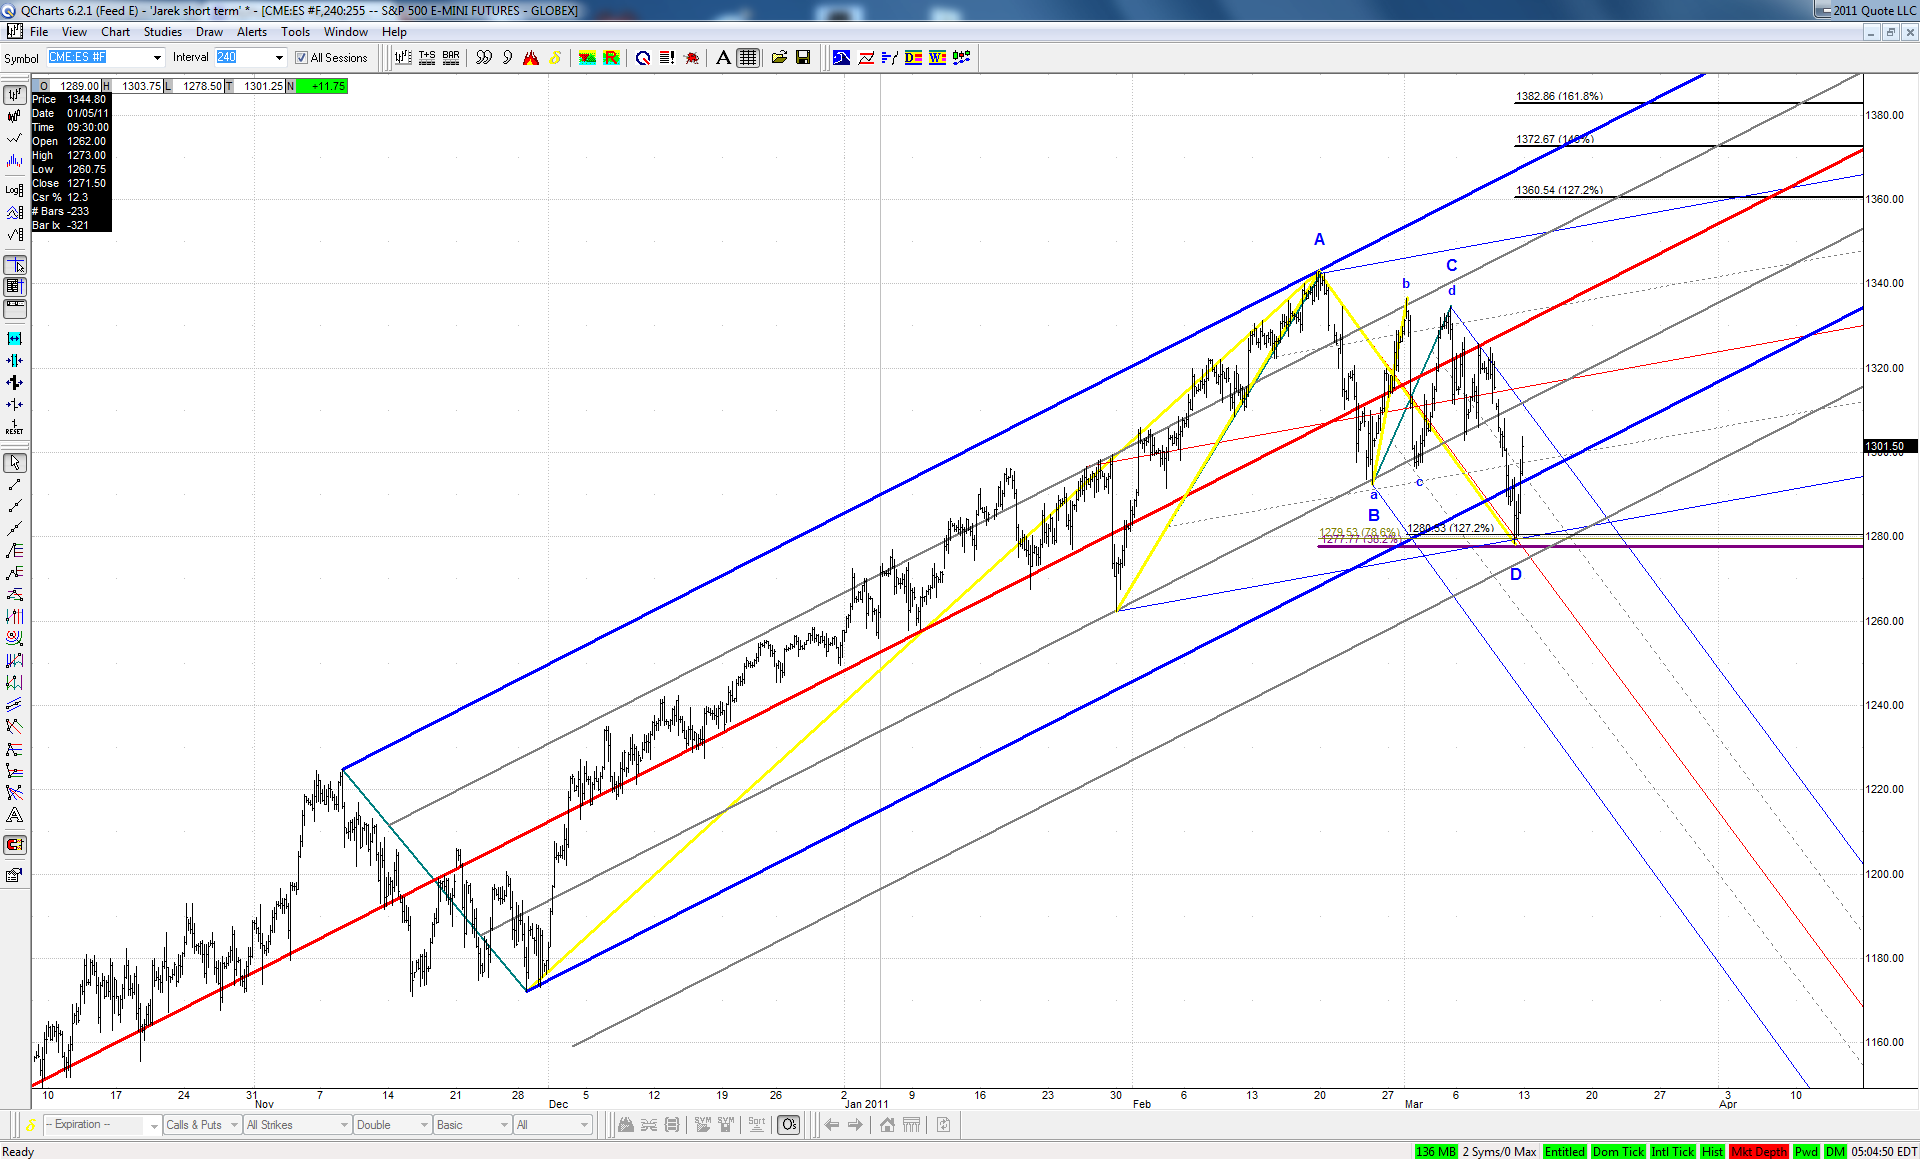

We have an almost ideal .382 bullish ABCD here. Thanks to Roofer's findings based on thousands of examples we know that probability of taking out the high equals in such case 87%. What's more in order to hit Jim's target zone at the line, a pretty fast move would be required... We'll see next week if we are on the right track and ... in the right train
JA
jarek
Rep: 94
Posts: 3,474
Originally posted by tx_ches

...But the charts have been fantastic! Thanks jarek and rat and all the others...

You are welcome!
JA
jarek
Rep: 94
Posts: 3,474
Was this almost ideal 1.272 off our DB ABCD already it??

Click image for original size
JA
jarek
Rep: 94
Posts: 3,474
I found the following geometry for the current GLOBEX bottom:

Click image for original size


It also lies almost to the tick at 0.300 retracement of the Jul 2010 - Feb 2011 move
JA
jarek
Rep: 94
Posts: 3,474
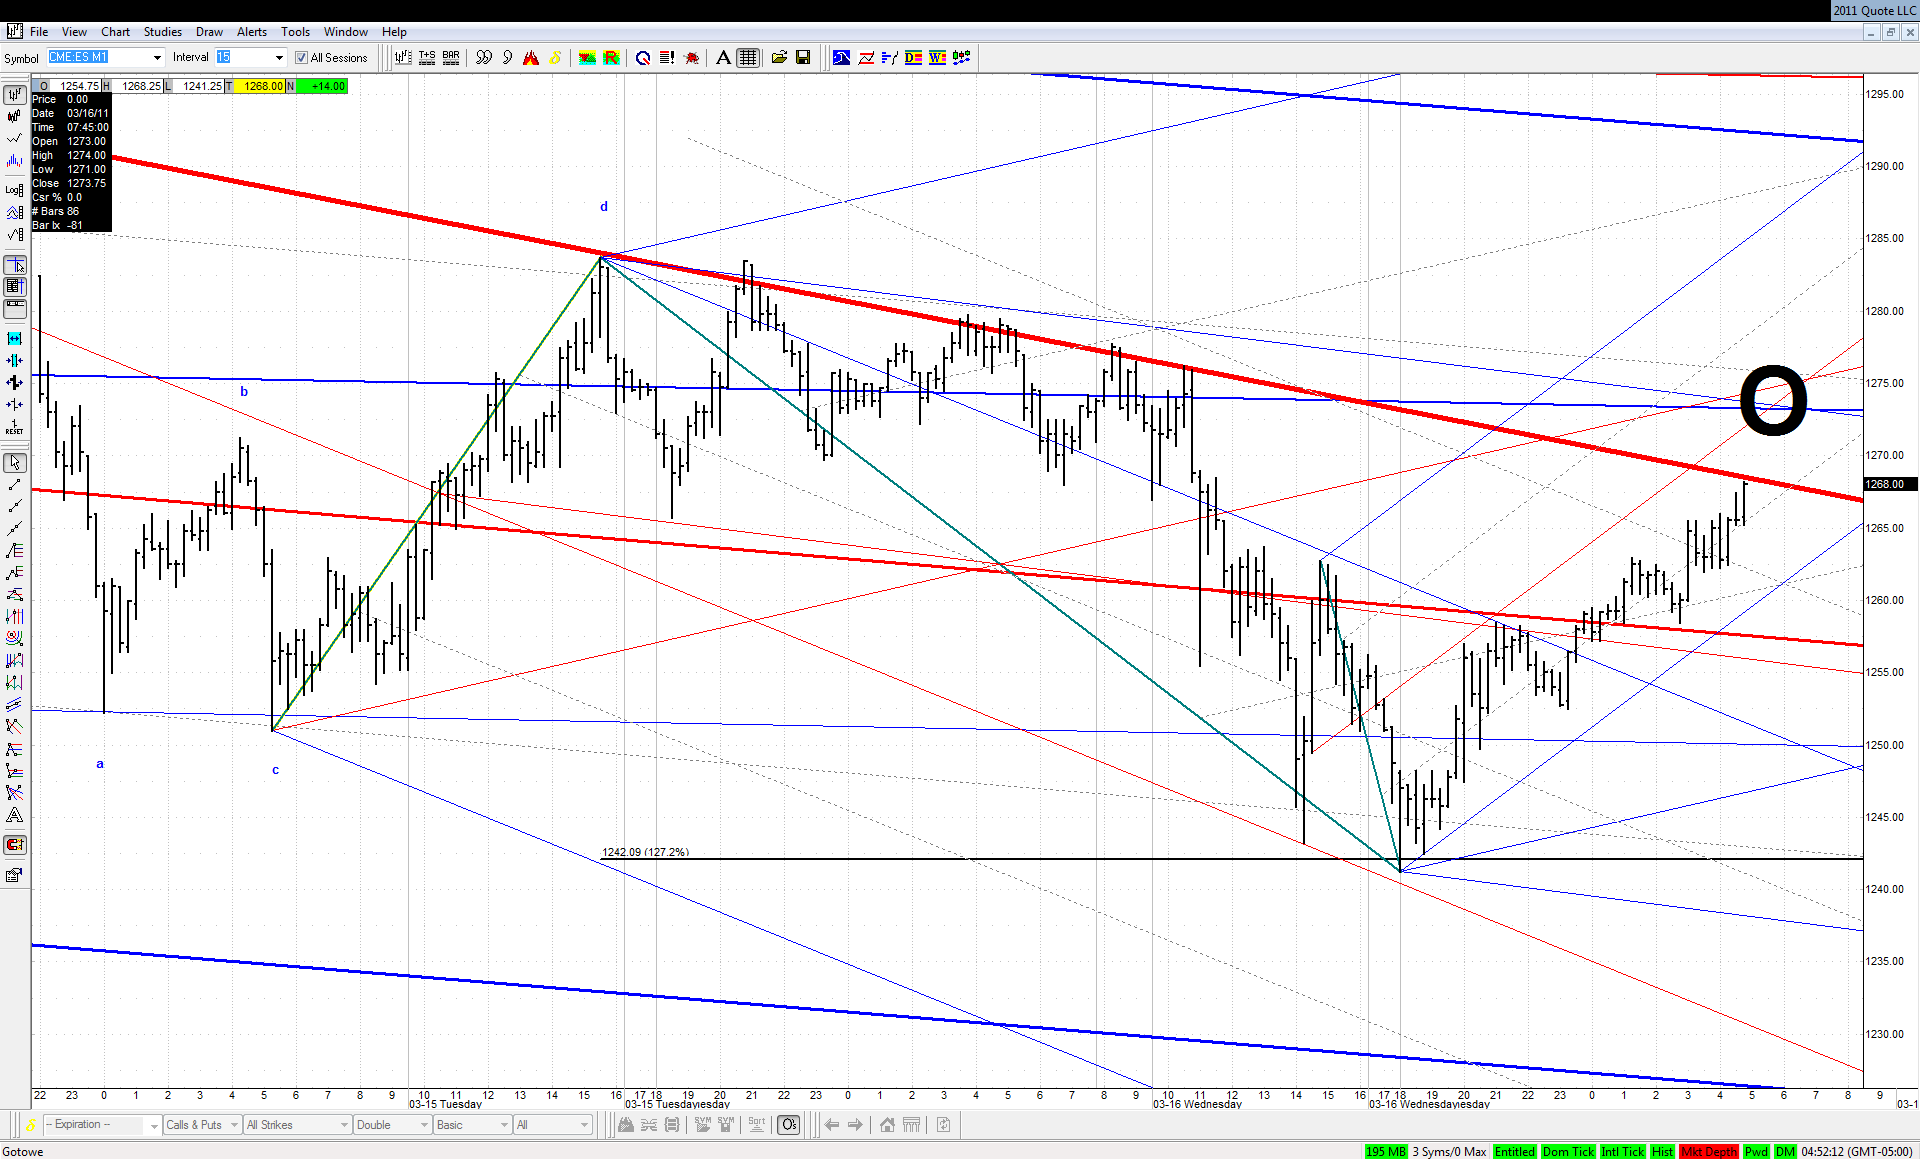
We have arrived at our downsloping TL for the 6th time in the last 2 days. Will this line confluence magnet help to get through this time around?

Click image for original size
JA
jarek
Rep: 94
Posts: 3,474
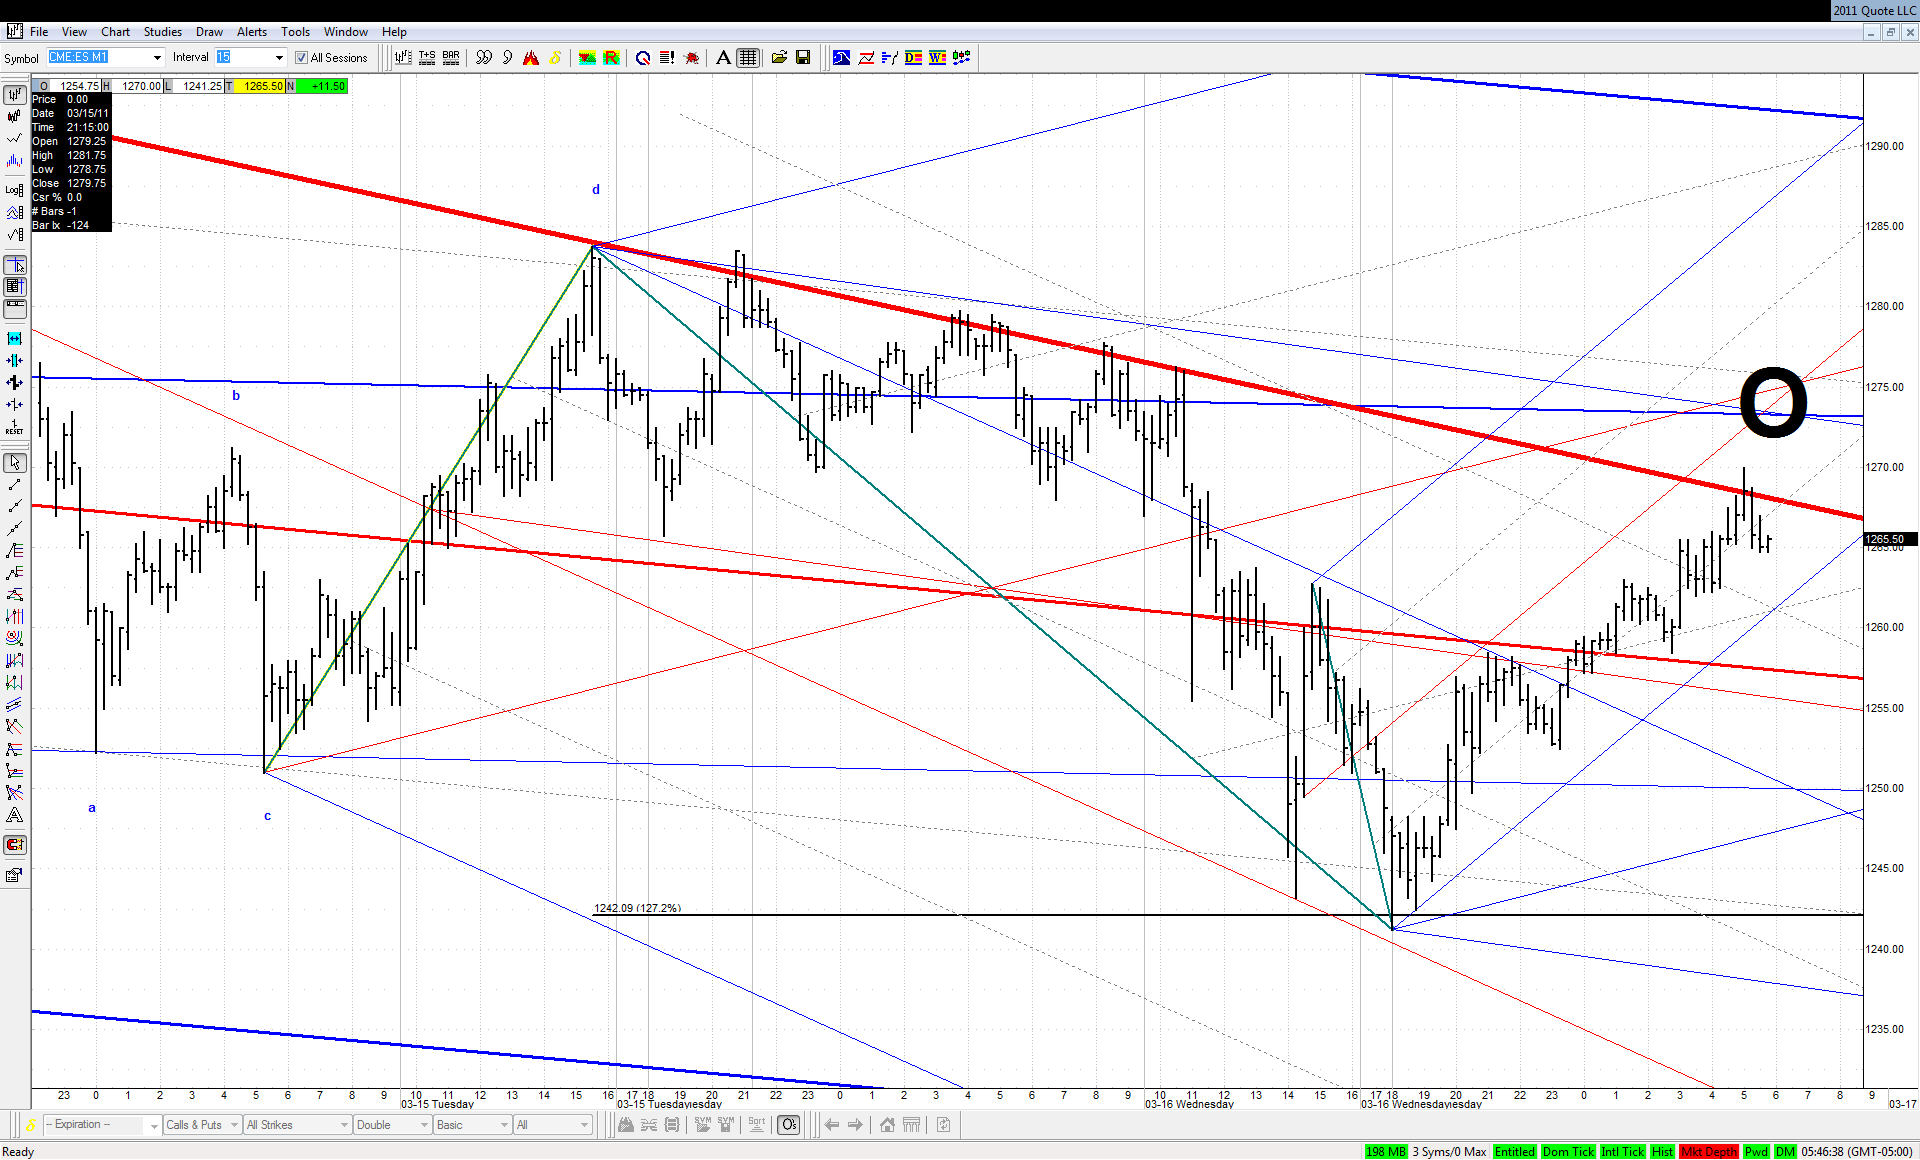
... and the gates remained closed again! Bulls may remember this line for quite some time!

Click image for original size
JA
jarek
Rep: 94
Posts: 3,474
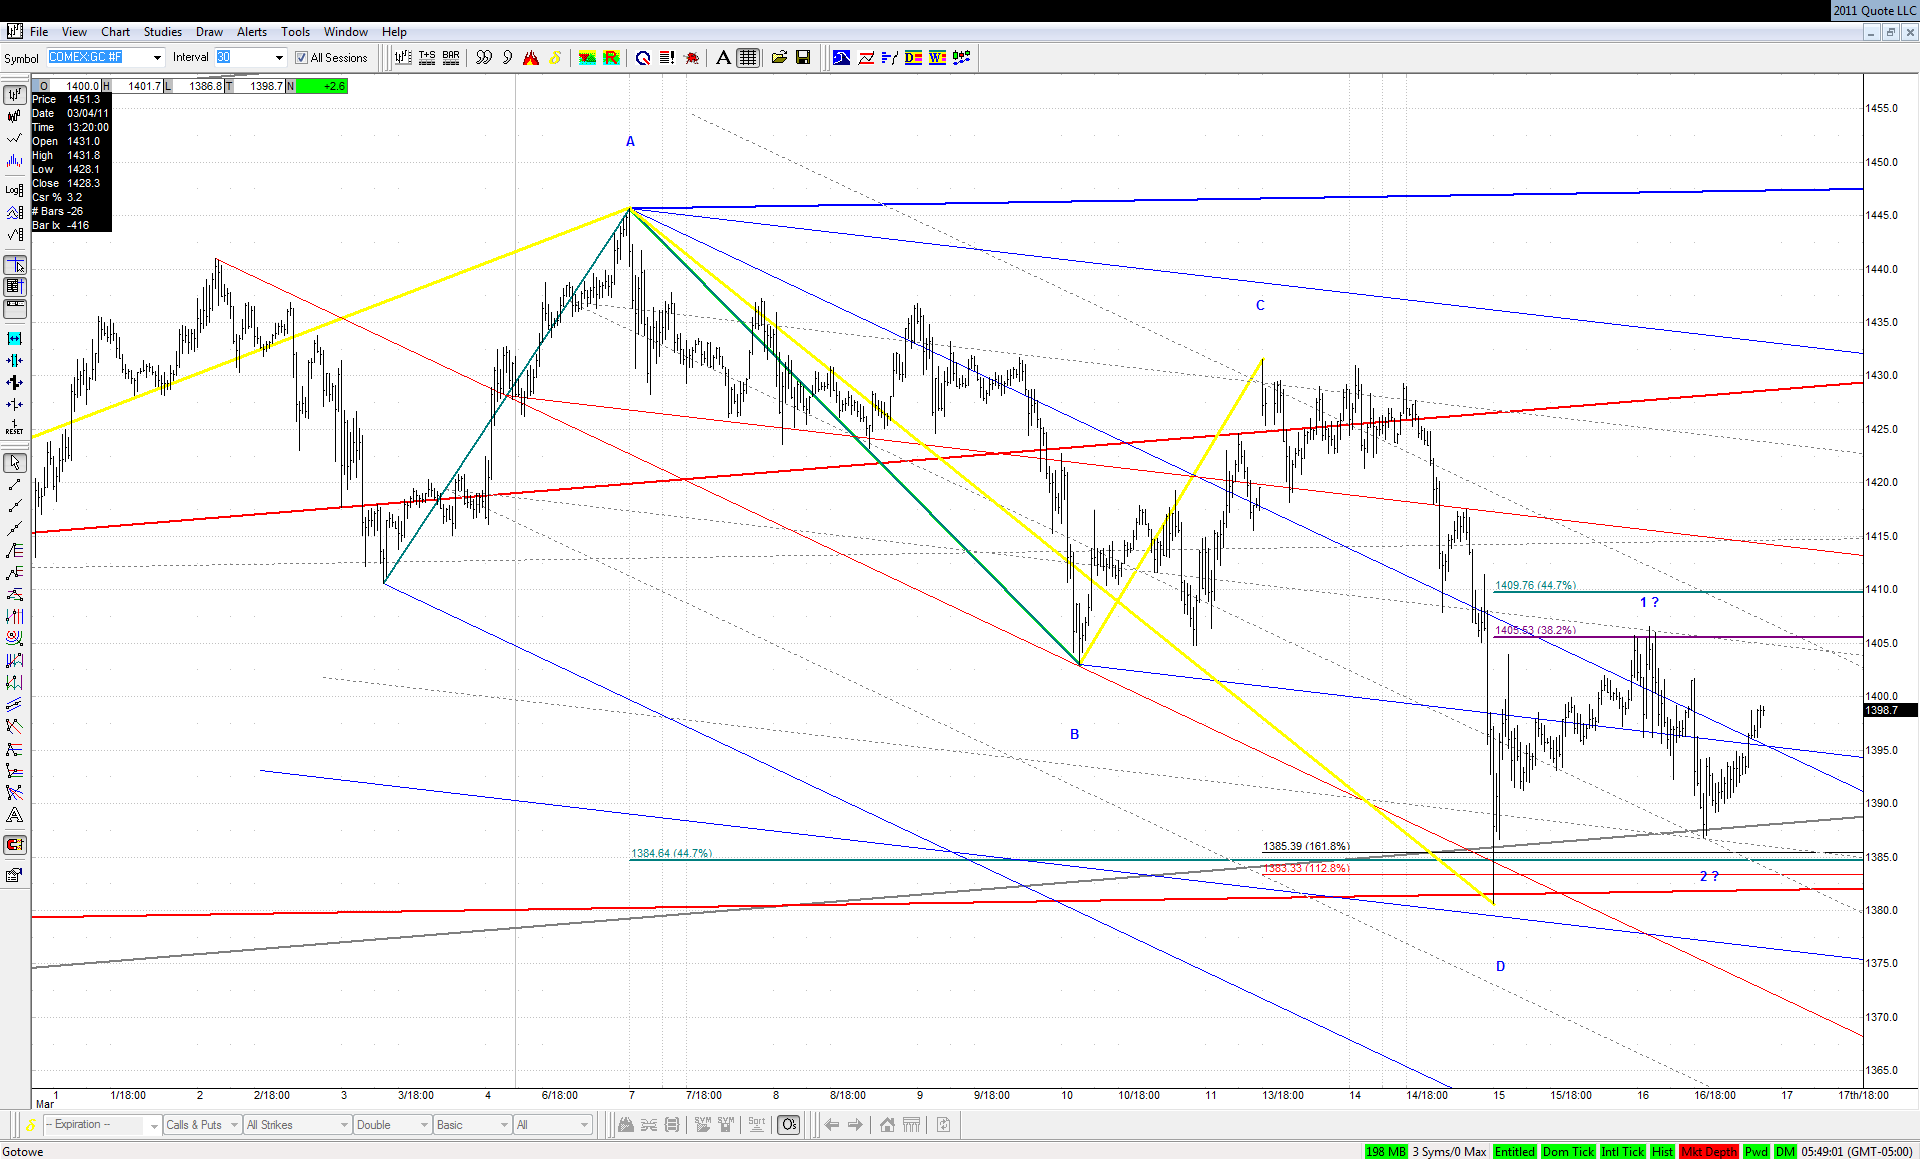
Our bullish ABCD in Gold is still intact:

Click image for original size


... but bulls need to get over the Kane Zone as soon as possible
JA
jarek
Rep: 94
Posts: 3,474
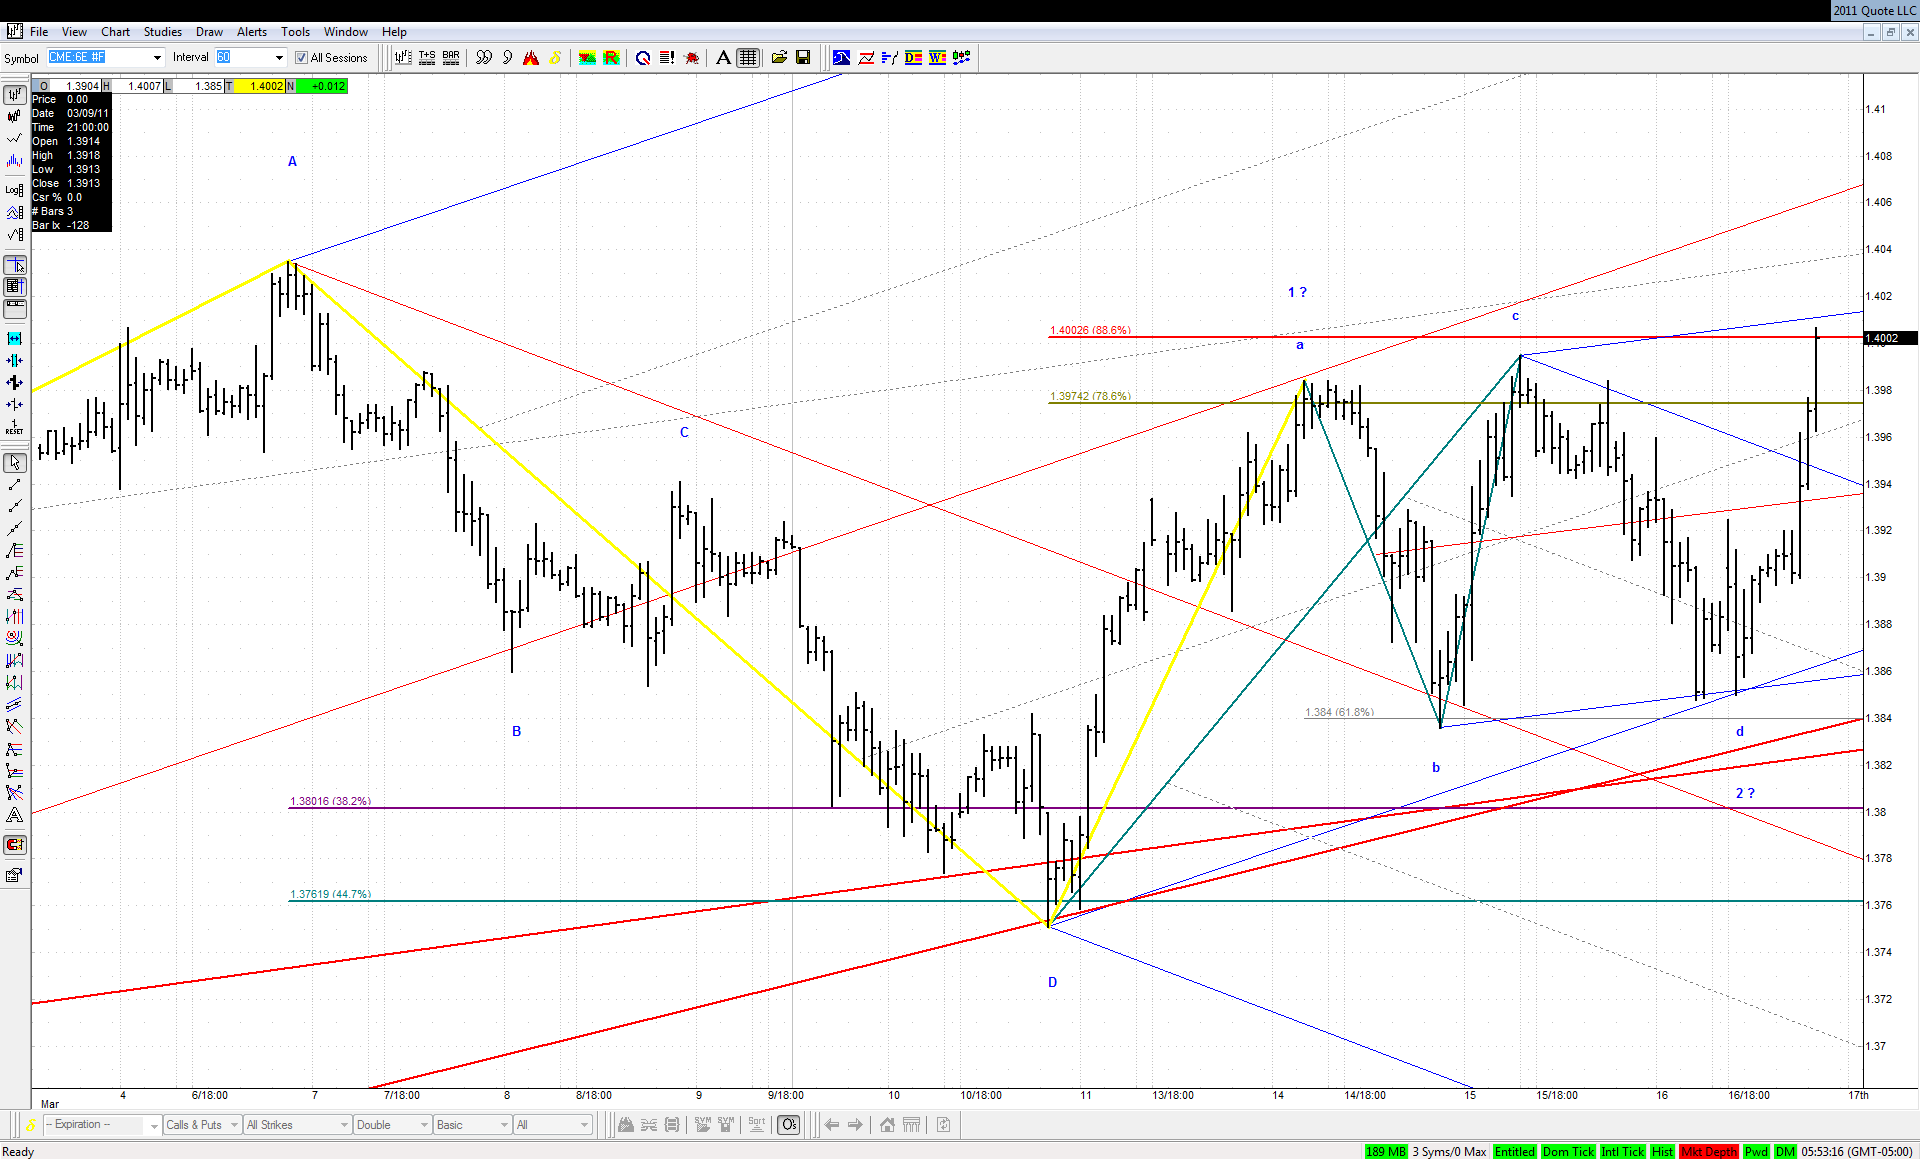
A small surprise in EUR where the move of our bigger bullish ABCD defended itself with a W2 Flat ABCD and now threatens this RTH setup:

Click image for original size
JA
jarek
Rep: 94
Posts: 3,474
Originally posted by jarek

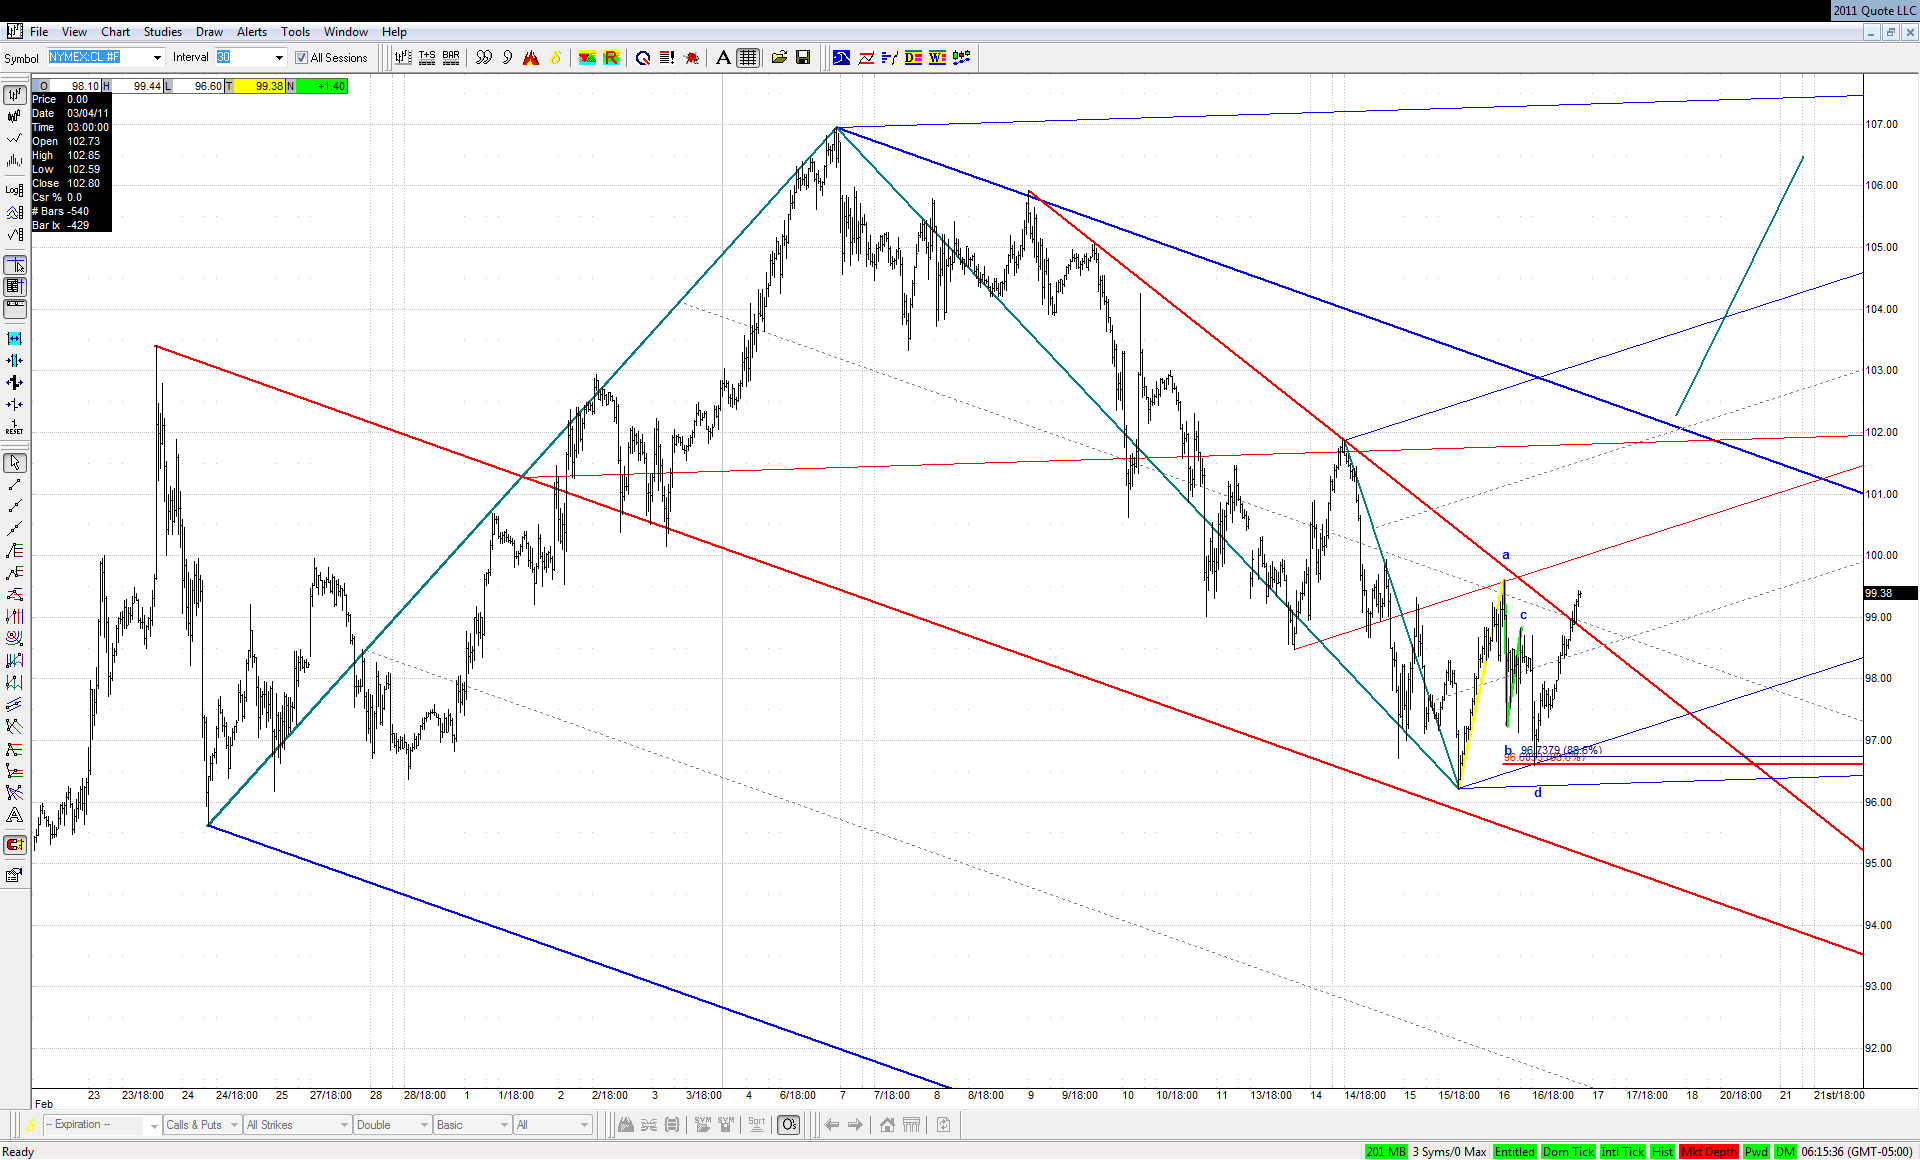
Shall we consider this all important downsloping major ML in Crude as already reached despite a 30 cents miss? ...

It certainly looks so at this point. After the low there was a double .886 bullish ABCD at line (and with abcd in the BC leg) and now the downsloping TL was taken over:

Click image for original size


That lines confluence around 102 may look enticing, but I'll be watching at all possible ABCDs on the way up of which this double .886 ABCD would be just the BC leg.
JA
jarek
Rep: 94
Posts: 3,474
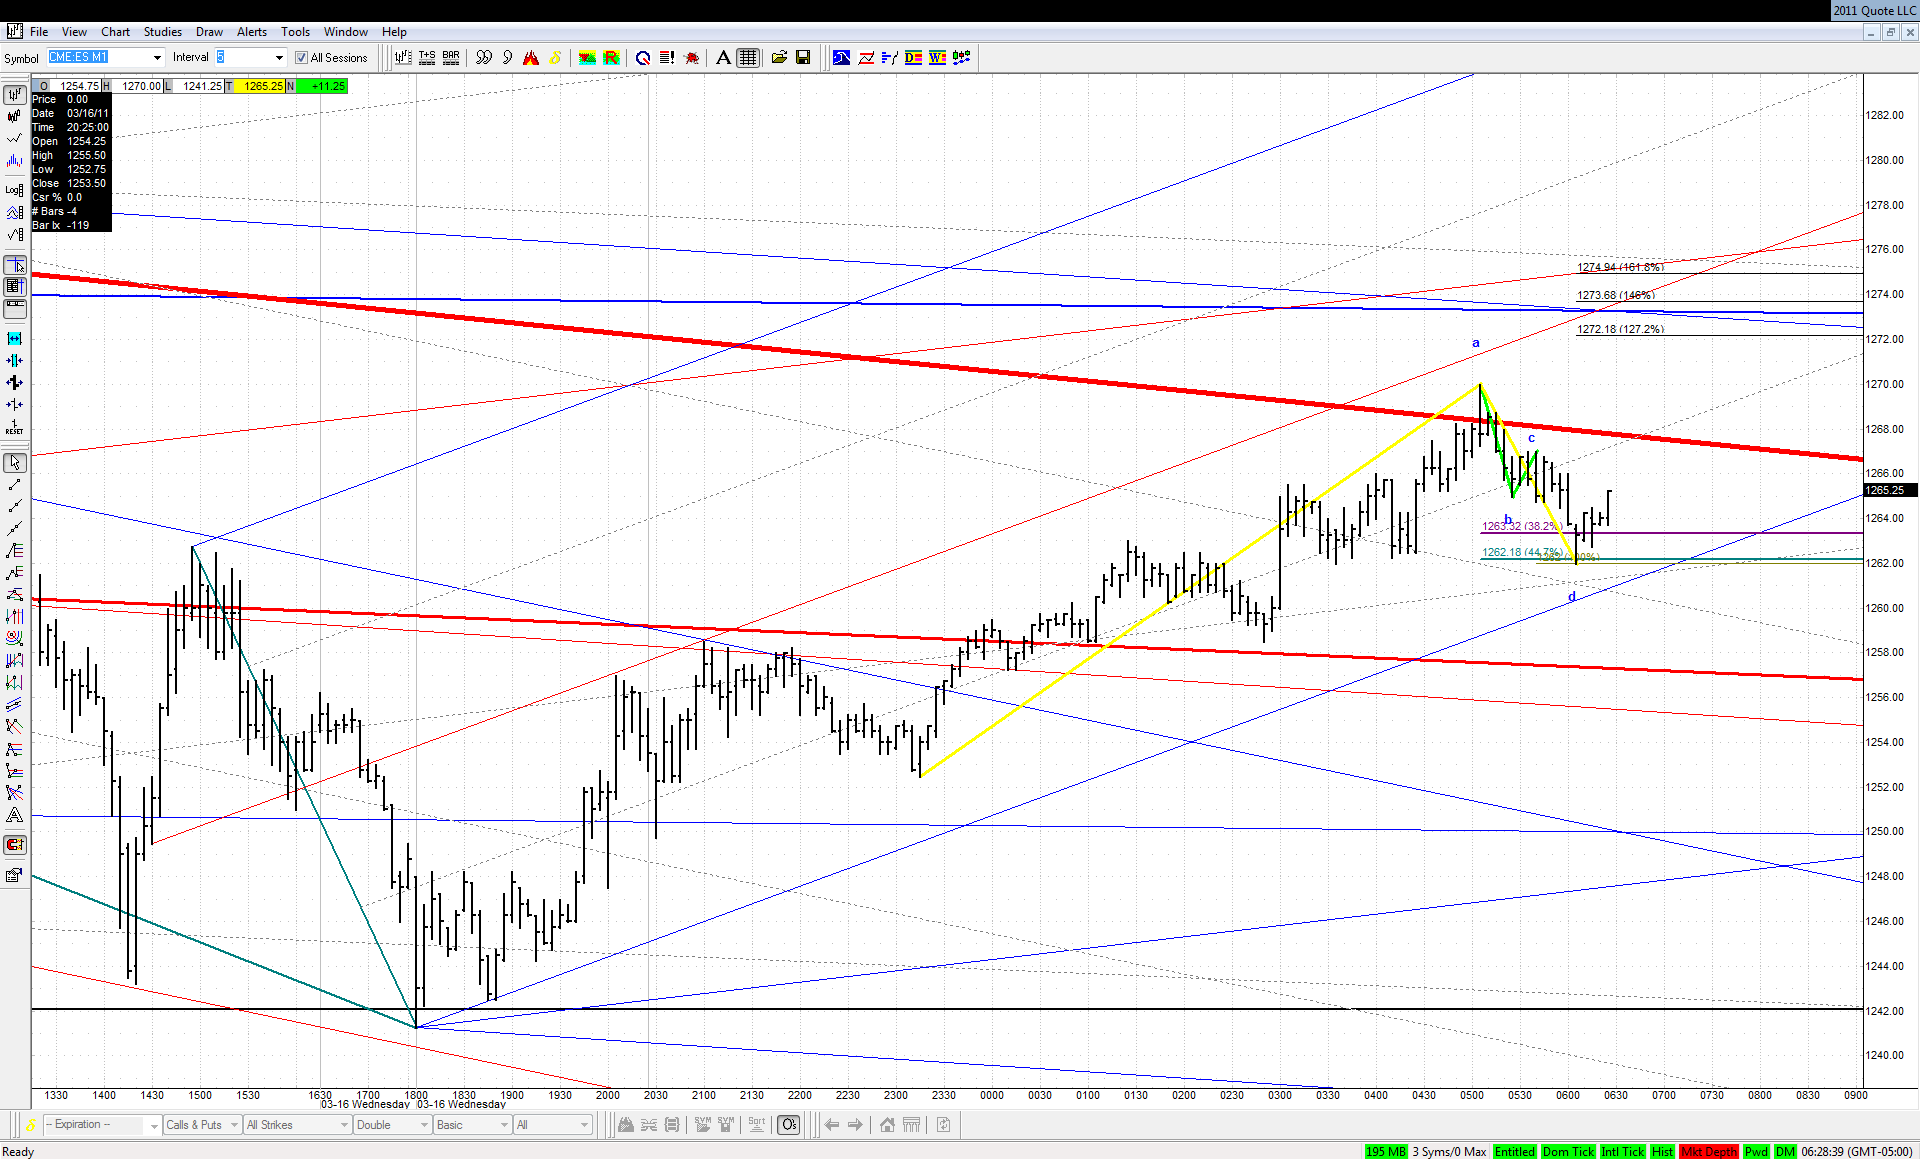
Was this the plan to step back a little and use this small KZ 1.000 ABCD as a battering ram for the fortress gate?


Click image for original size
JA
jarek
Rep: 94
Posts: 3,474
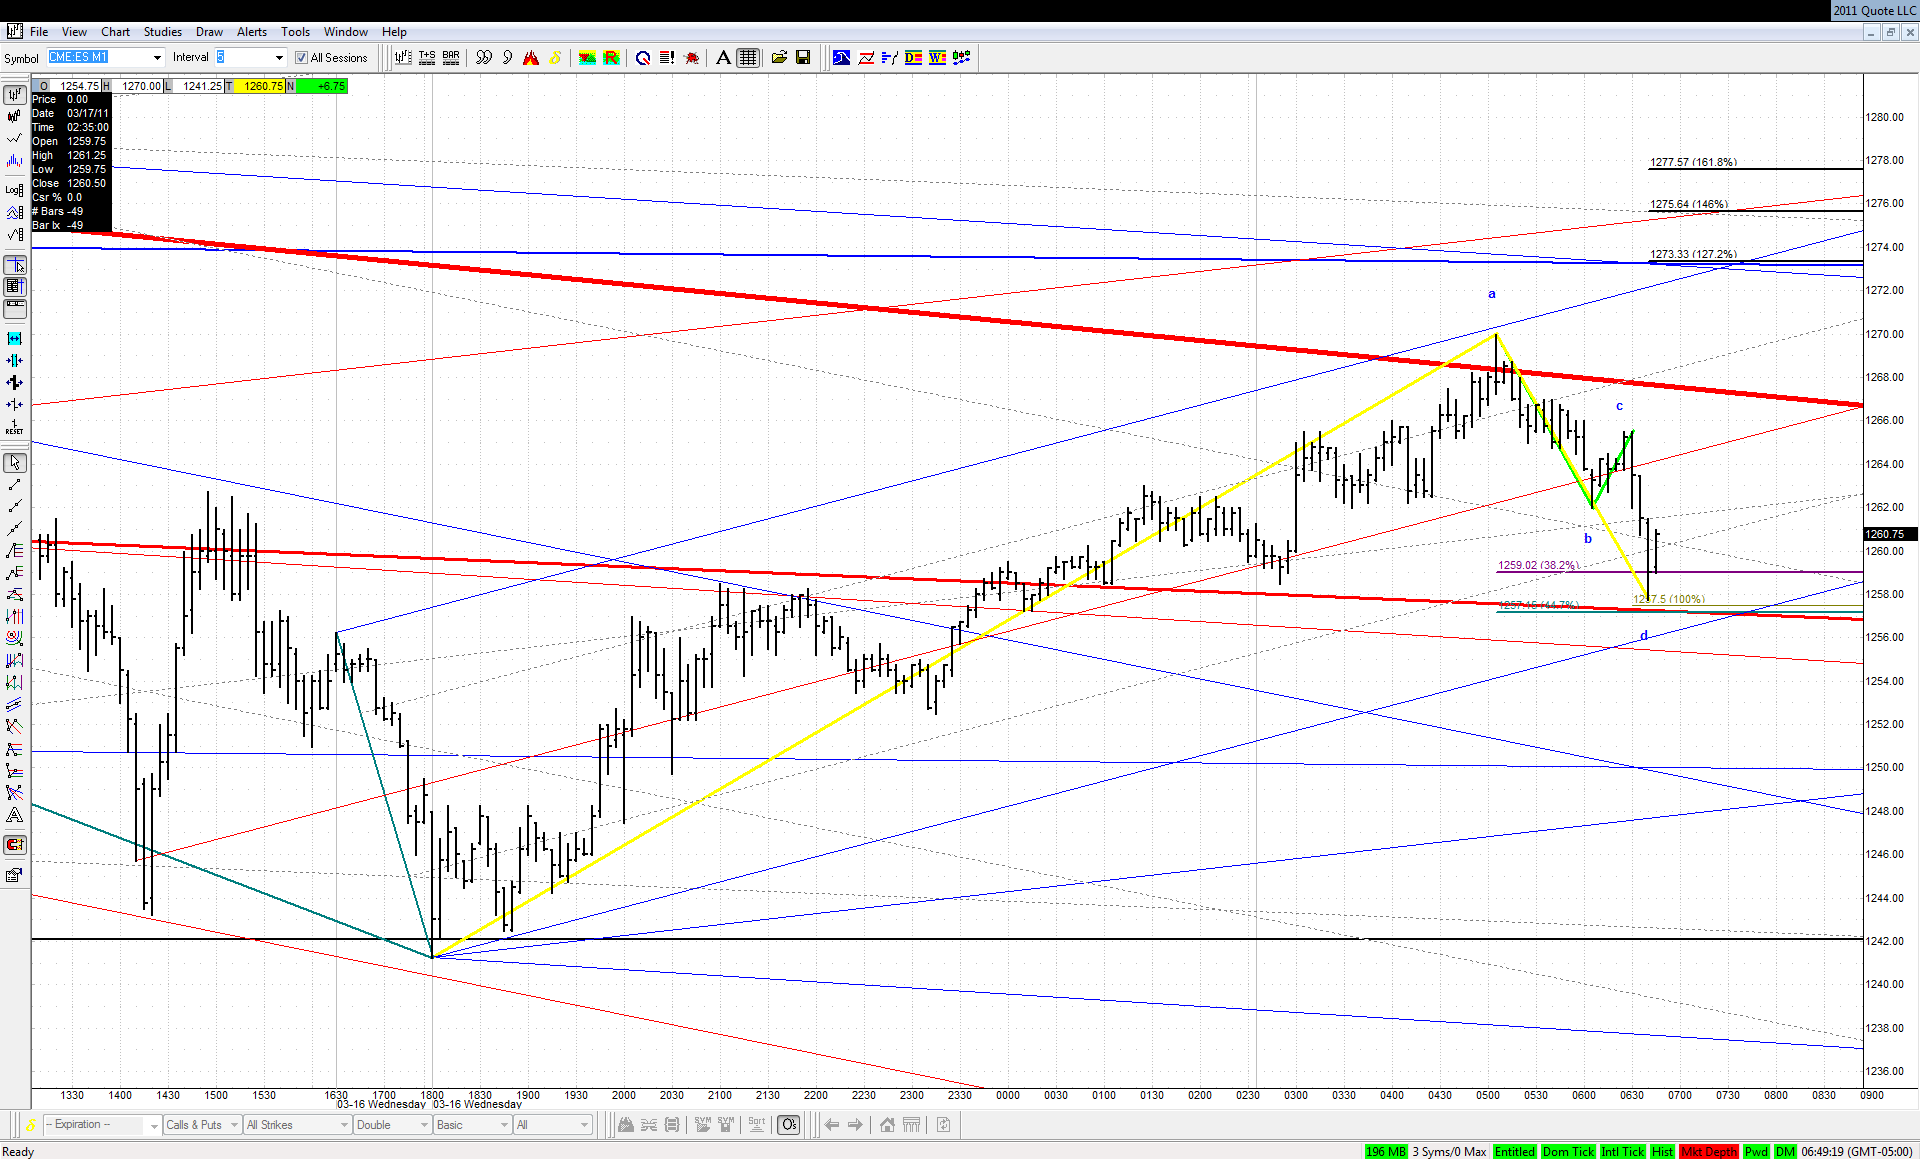
Nope - but they may be coming back with even bigger ram!


Click image for original size
TX
tx_ches
Rep: -10
Posts: 514
Practice work. I consolidated what Jarek did on the ES 15 minute chart. I'm only showing the last 2 days -- from where I left off on Wednesday.

Click image for original size