MyPivots
Sign In
JA
jarek
Rep: 94
Posts: 3,474
There is not much to add to the extensive coverage of the recent weeks here. While looking for geometry of Friday's turn on the continuous contract basis I came up with the following picture:

Click image for original size
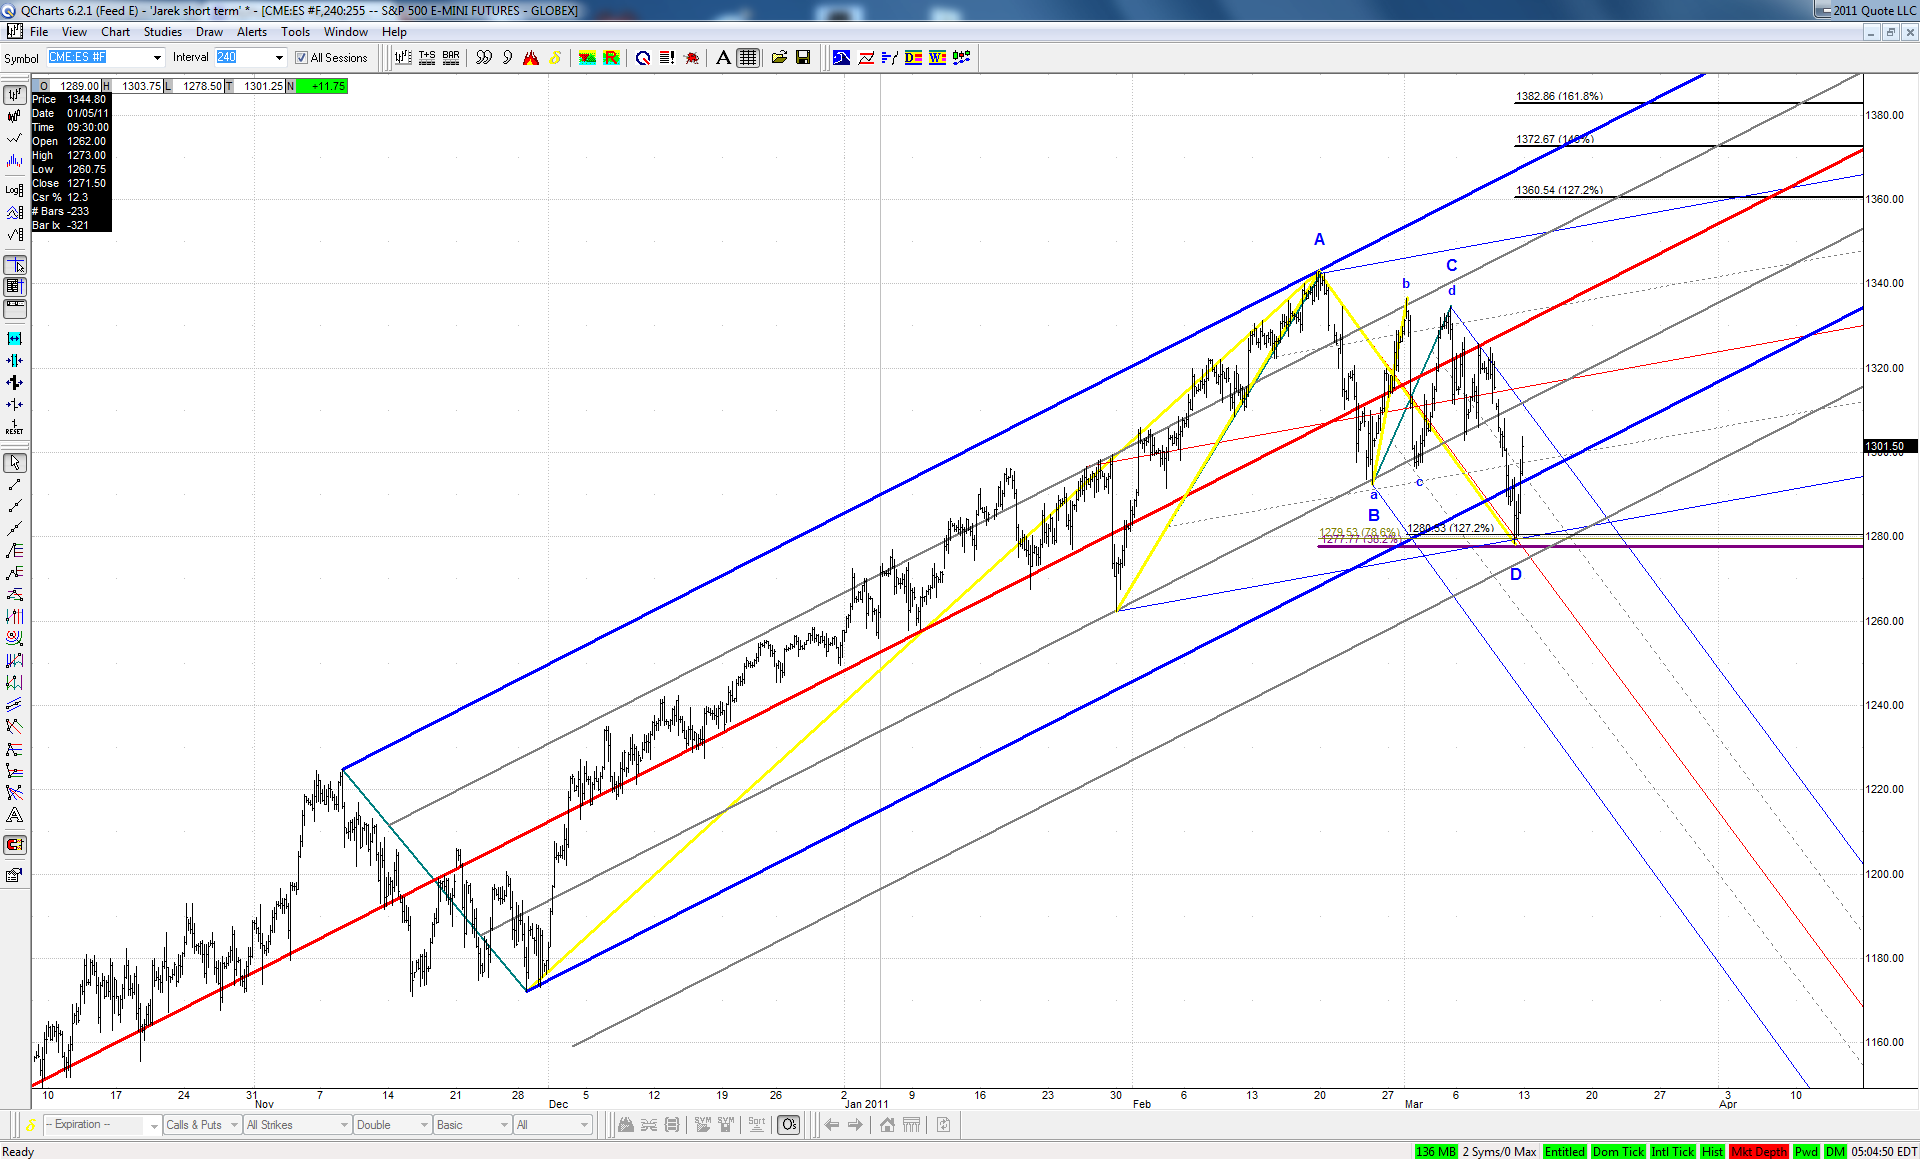

We have an almost ideal .382 bullish ABCD here. Thanks to Roofer's findings based on thousands of examples we know that probability of taking out the high equals in such case 87%. What's more in order to hit Jim's target zone at the line, a pretty fast move would be required... We'll see next week if we are on the right track and ... in the right train
JI
jimkane
Rep: 3,058
Posts: 33,089
And there's a new low...
JI
jimkane
Rep: 3,058
Posts: 33,089
Nikkei down another 6%, after the 6% last night. Wow, about 12% in two days...
JI
jimkane
Rep: 3,058
Posts: 33,089
And there's a new low for the entire ES drop off the 'top', below the big ABCD reversal point.
JI
jimkane
Rep: 3,058
Posts: 33,089
ES almost in freefall now...
JI
jimkane
Rep: 3,058
Posts: 33,089
Okay, watch 1275.25...
JI
jimkane
Rep: 3,058
Posts: 33,089
Okay, 1.128 at line and no reaction, right through. My next area is a little broad, but it is around 65.50-67.00, and a layer right above around 69.75-71.50. But, this area here it didn't react to, at the 1.128, it has several lines, including a good SL, and it really 'should' react a bit there, so I wonder if that was just a little overzealous overshoot there. I'm watching for that.
JI
jimkane
Rep: 3,058
Posts: 33,089
Understand, I think the trend is strongly down, so these areas are only for management at this point. The area this afternoon was an area where the trend may have reasserted itself (it did), as it was with the expected trend direction.
JI
jimkane
Rep: 3,058
Posts: 33,089
First level hit...
JI
jimkane
Rep: 3,058
Posts: 33,089
Sure looks like they very short-term sold it out. But you never know, so I'm just letting it do what it does, so to speak. In other words, I would base any decisions I might make on what it actually does, not on what I think it may do.
RO
roofer
Rep: 3,689
Posts: 3,574
over the months of jan and feb across hundreds of stocks the geometry of a crash built like the snow pack of a potential avalanche...hundreds of stocks with mimimum targets AND crash targets.. i stood alone at this forum willing to relentlessly short, even dubbing myself the mad short seller.because i saw the bigger picture.even then, i knew it would take something to push price past the normal pullback targets and on to crash targets... day after day i doubted myself... and yet at night i saw no stock escaping the geometry when i reviewed my charts.
TX
tx_ches
Rep: -10
Posts: 514
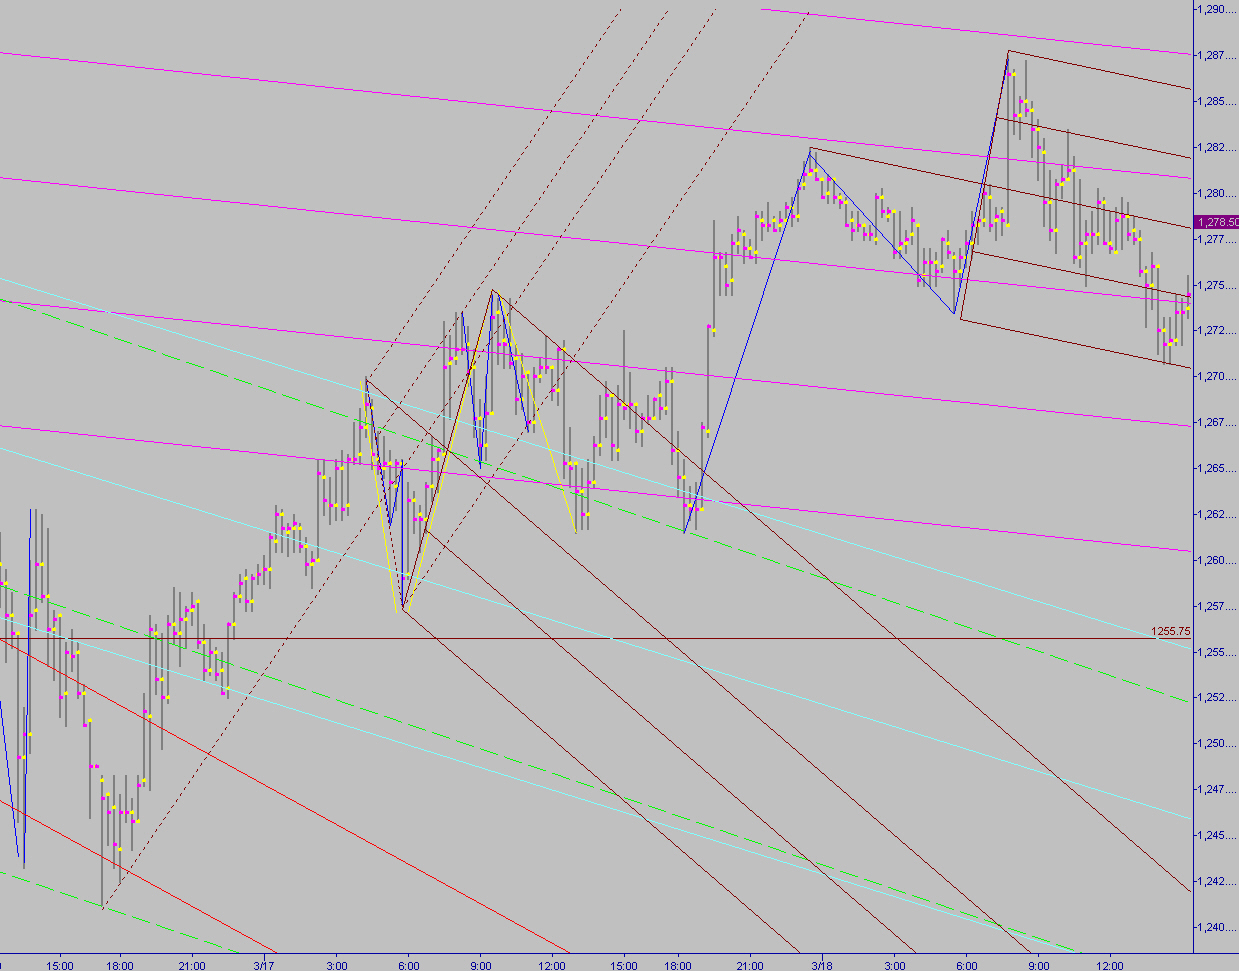
Practice work. I consolidated what Jarek did on the ES 15 minute chart. I'm only showing the last 2 days -- from where I left off on Wednesday.

Click image for original size