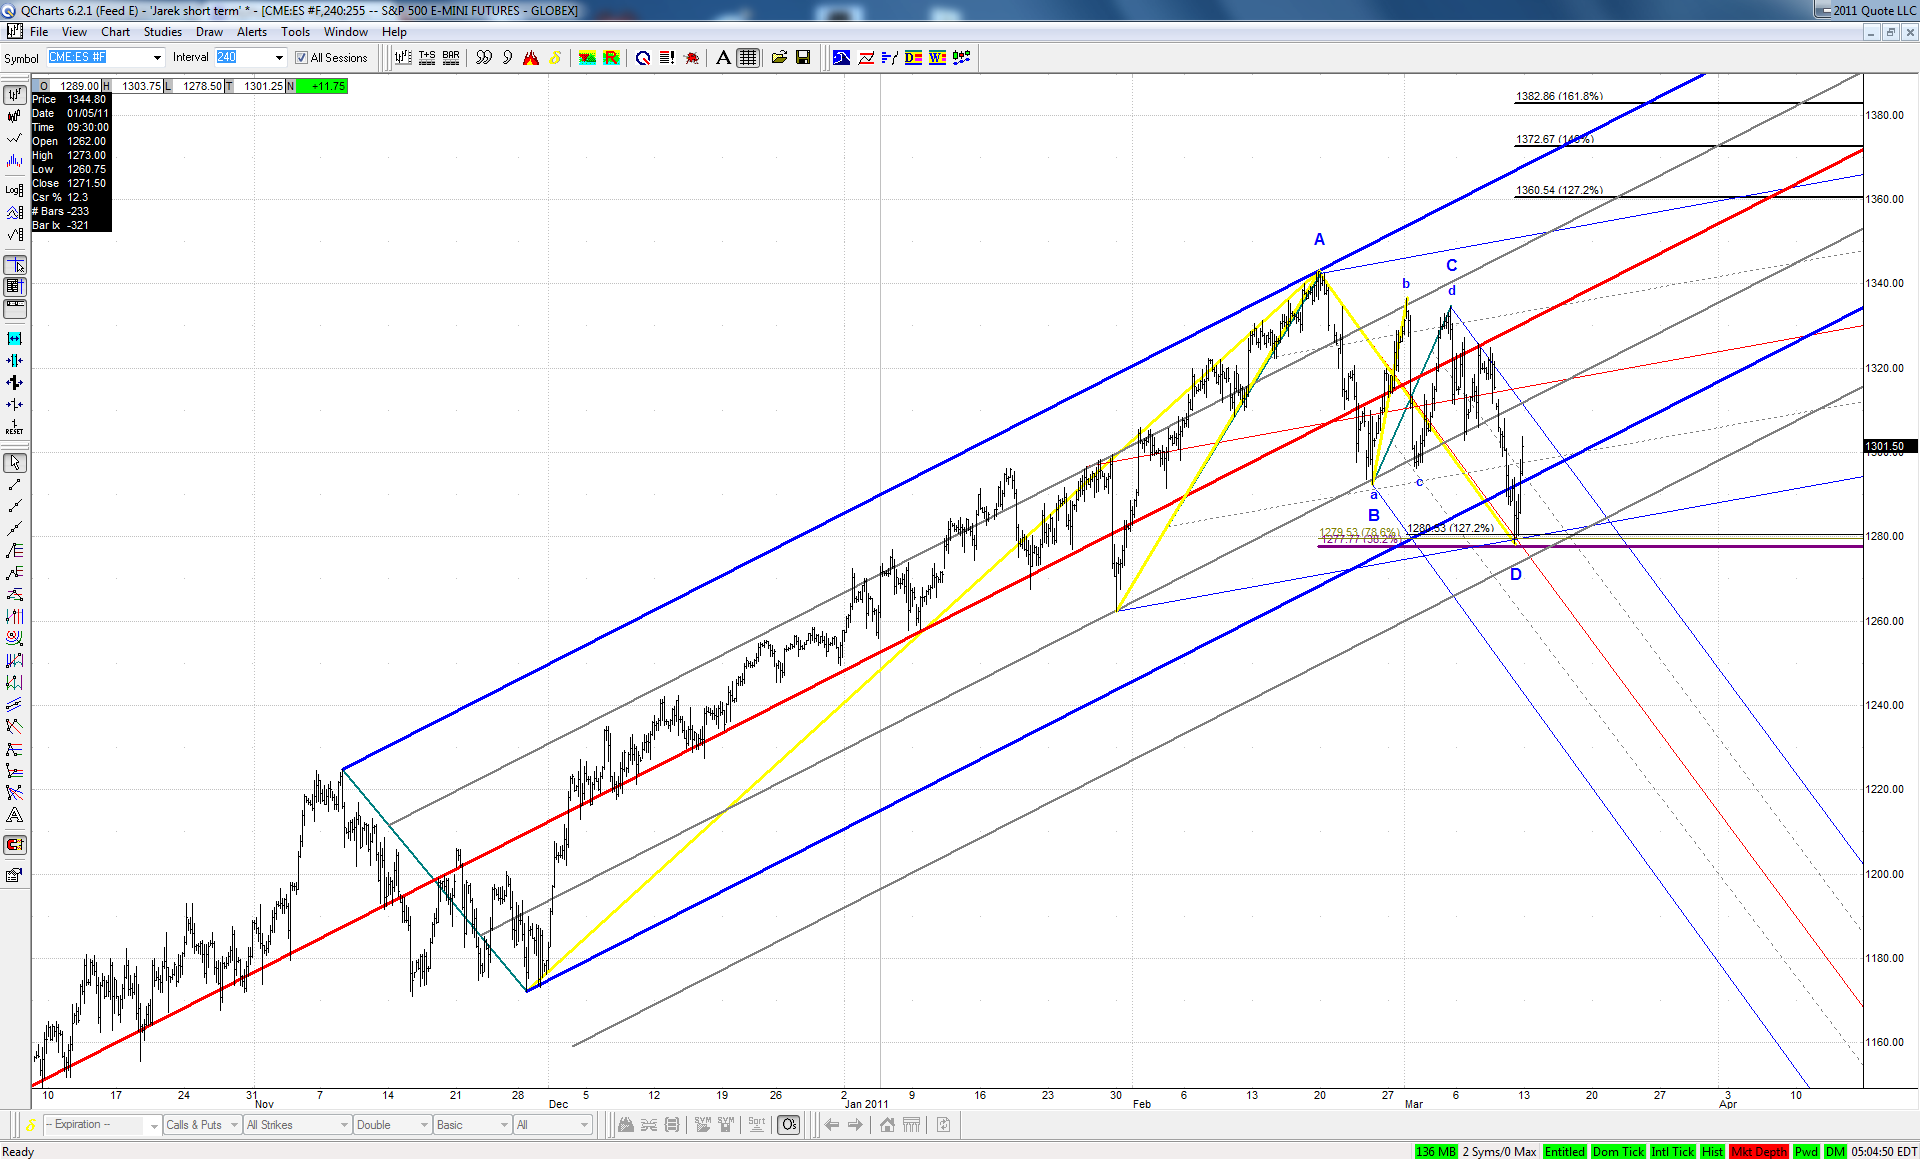
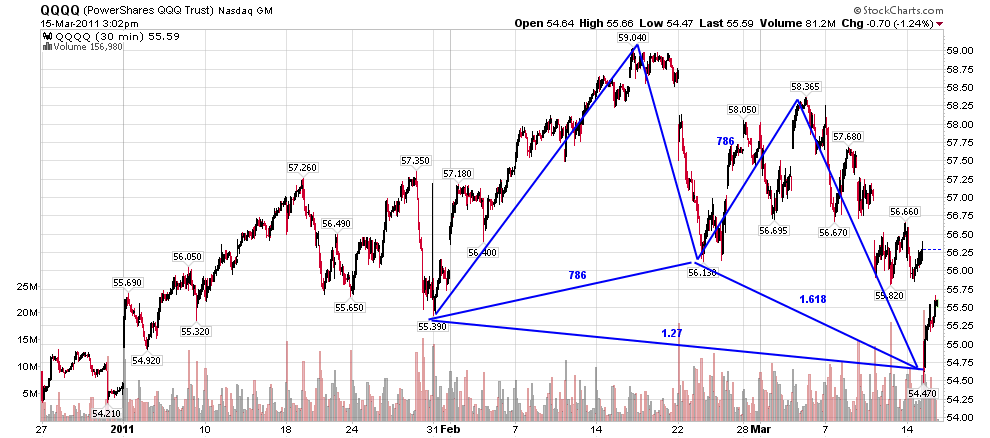
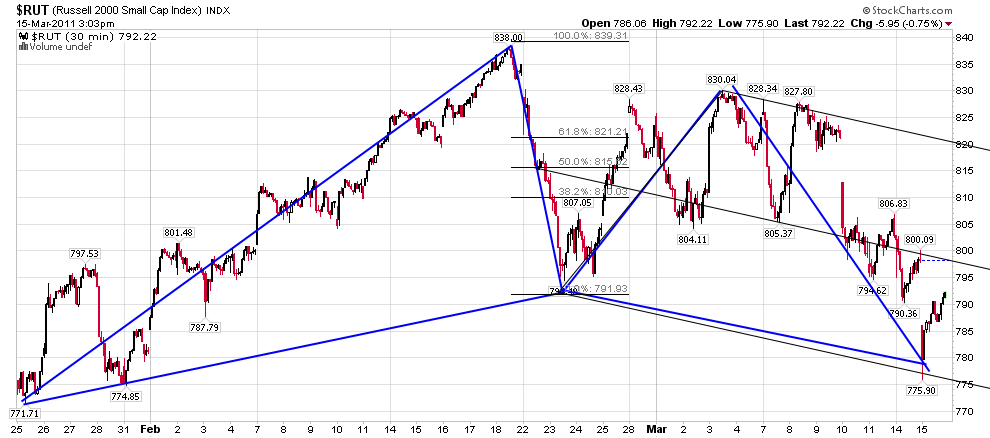
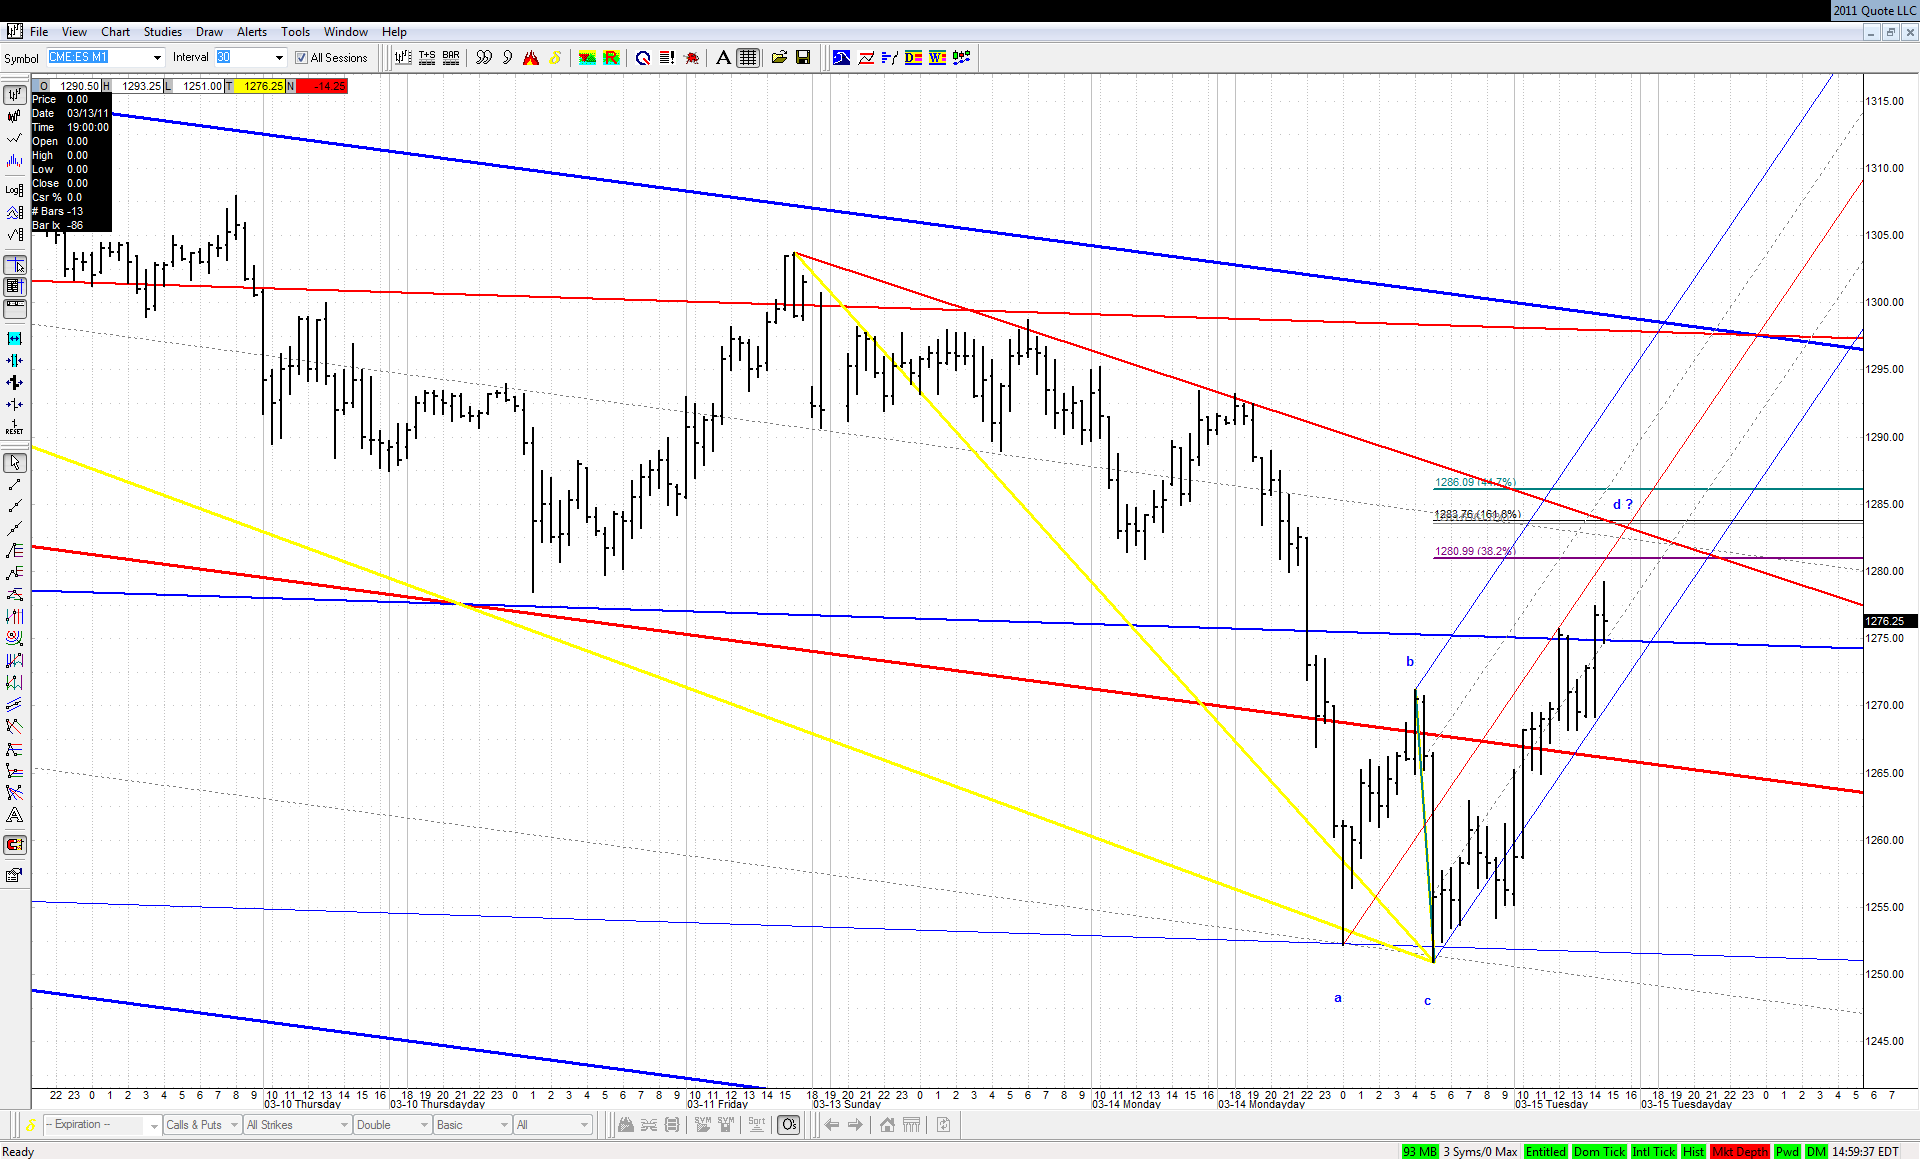
There is not much to add to the extensive coverage of the recent weeks here. While looking for geometry of Friday's turn on the continuous contract basis I came up with the following picture:
We have an almost ideal .382 bullish ABCD here. Thanks to Roofer's findings based on thousands of examples we know that probability of taking out the high equals in such case 87%. What's more in order to hit Jim's target zone at the line, a pretty fast move would be required... We'll see next week if we are on the right track and ... in the right train
JI
jimkane
Rep: 3,058
Posts: 33,089
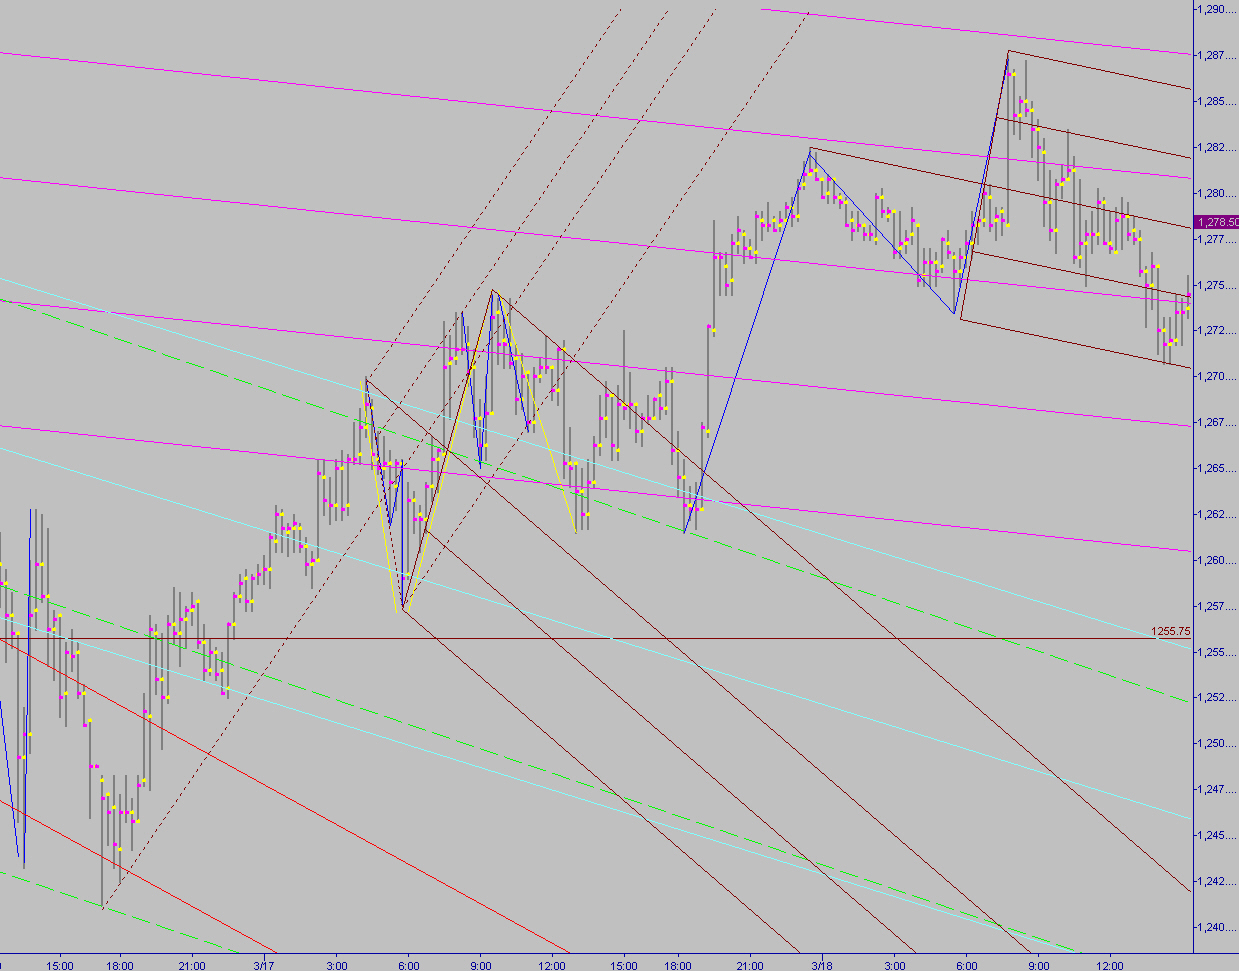
The next area I'm watching closely is around 81-83, but may stretch as far as 84. We'll see. There has been more than one time when I have posted that I see the shift to strong movement in the other direction, and that was the top tick at that point. Not that I thought that was a timely comment, just an observation that perhaps the buyers are back in control after the 'retest' of the low. This may also be a bearish DB ABCD coming in here...
JI
jimkane
Rep: 3,058
Posts: 33,089
Ah, I just went back and saw you slipped a chart in on me , jarek, beating my comment by almost four minutes, pointing to the same spot I mentioned above. You are all over this.
JI
jimkane
Rep: 3,058
Posts: 33,089
Yeah, that's the DB ABCD, jarek. But it has already hit past its 1.272, so it could be done at this point. It seems to be struggling to get up to the area. But I'd like to see it get into the confluence area. And nothing says it will react to the area, in the sense of fulfilling itself and sending this to new lows. Likely, if the short-term 'bottom' is in, this may produce a small, perhaps .382/.447 checkback, and then up it goes.