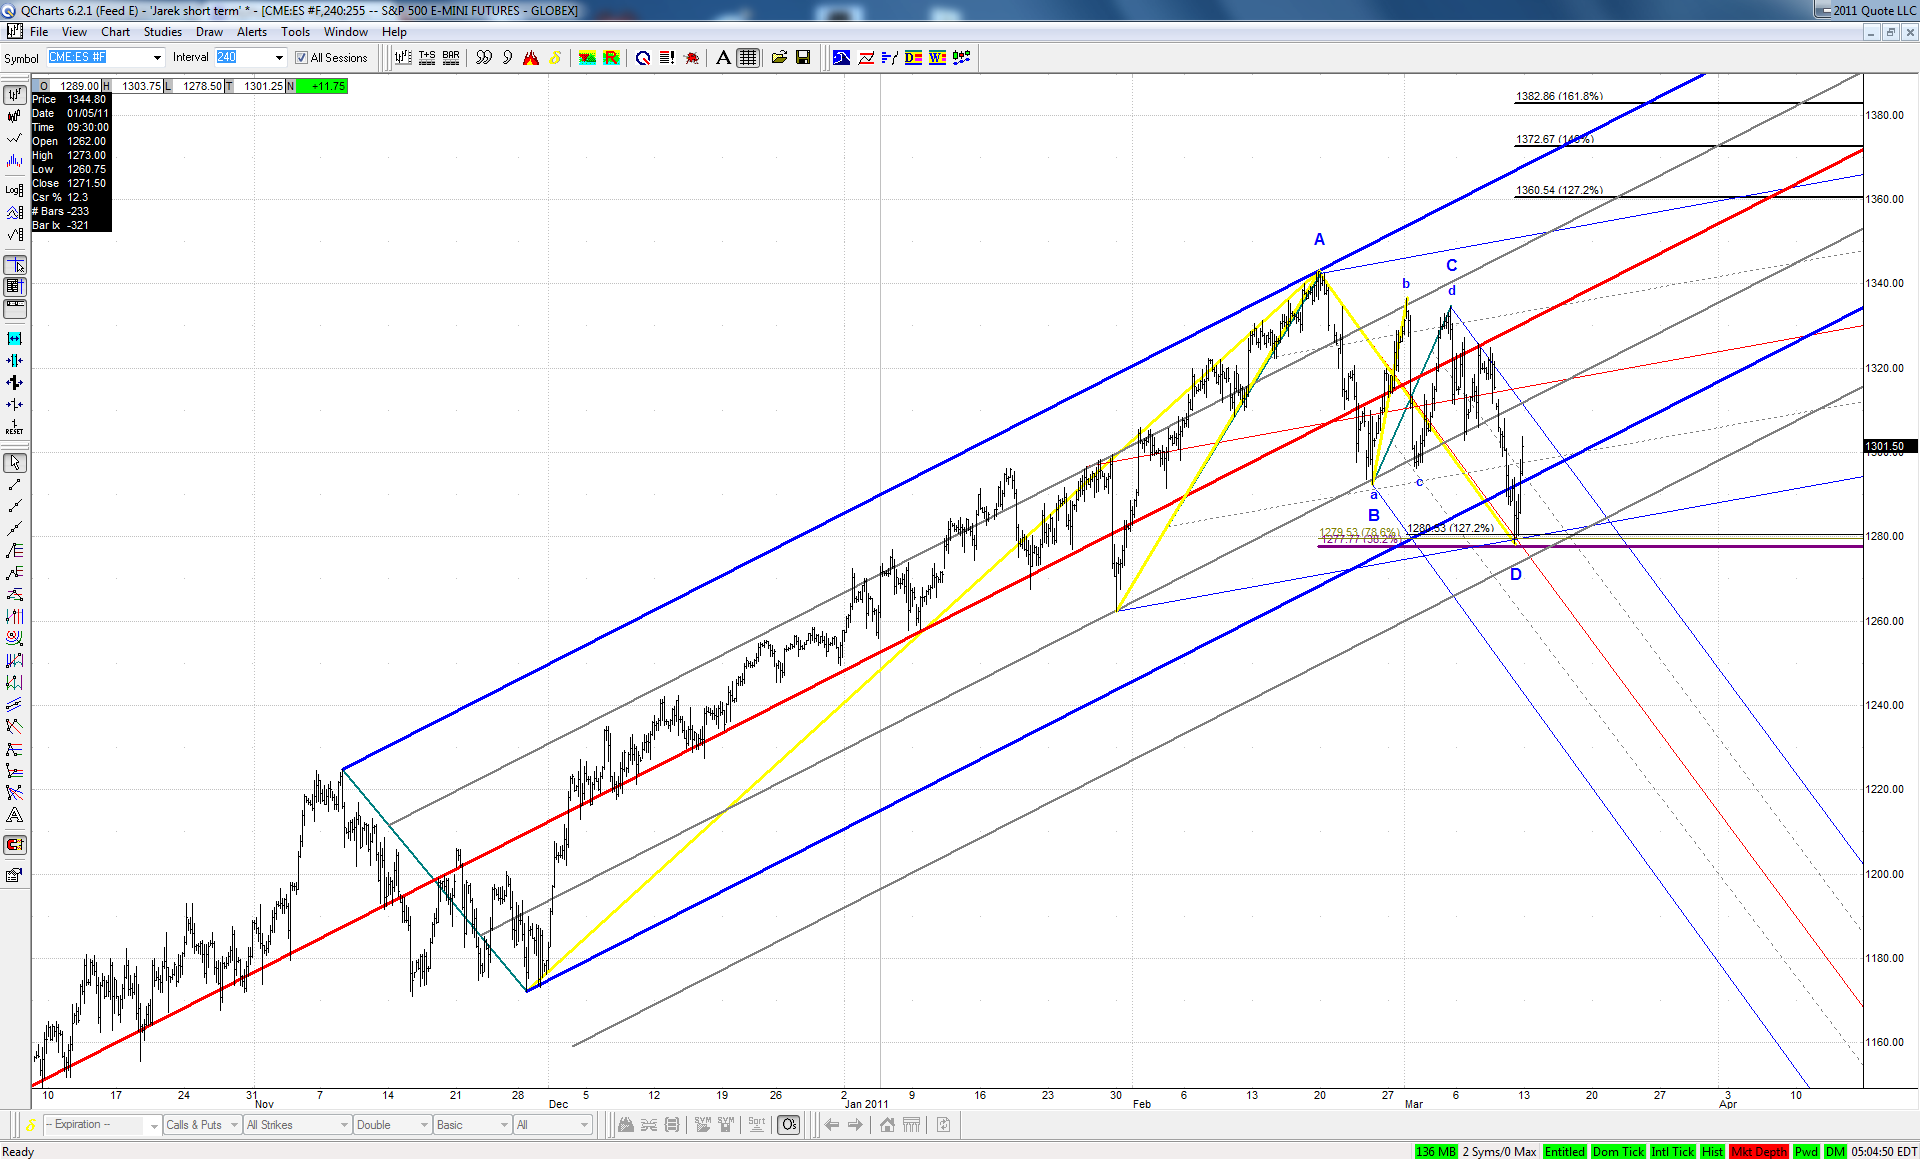
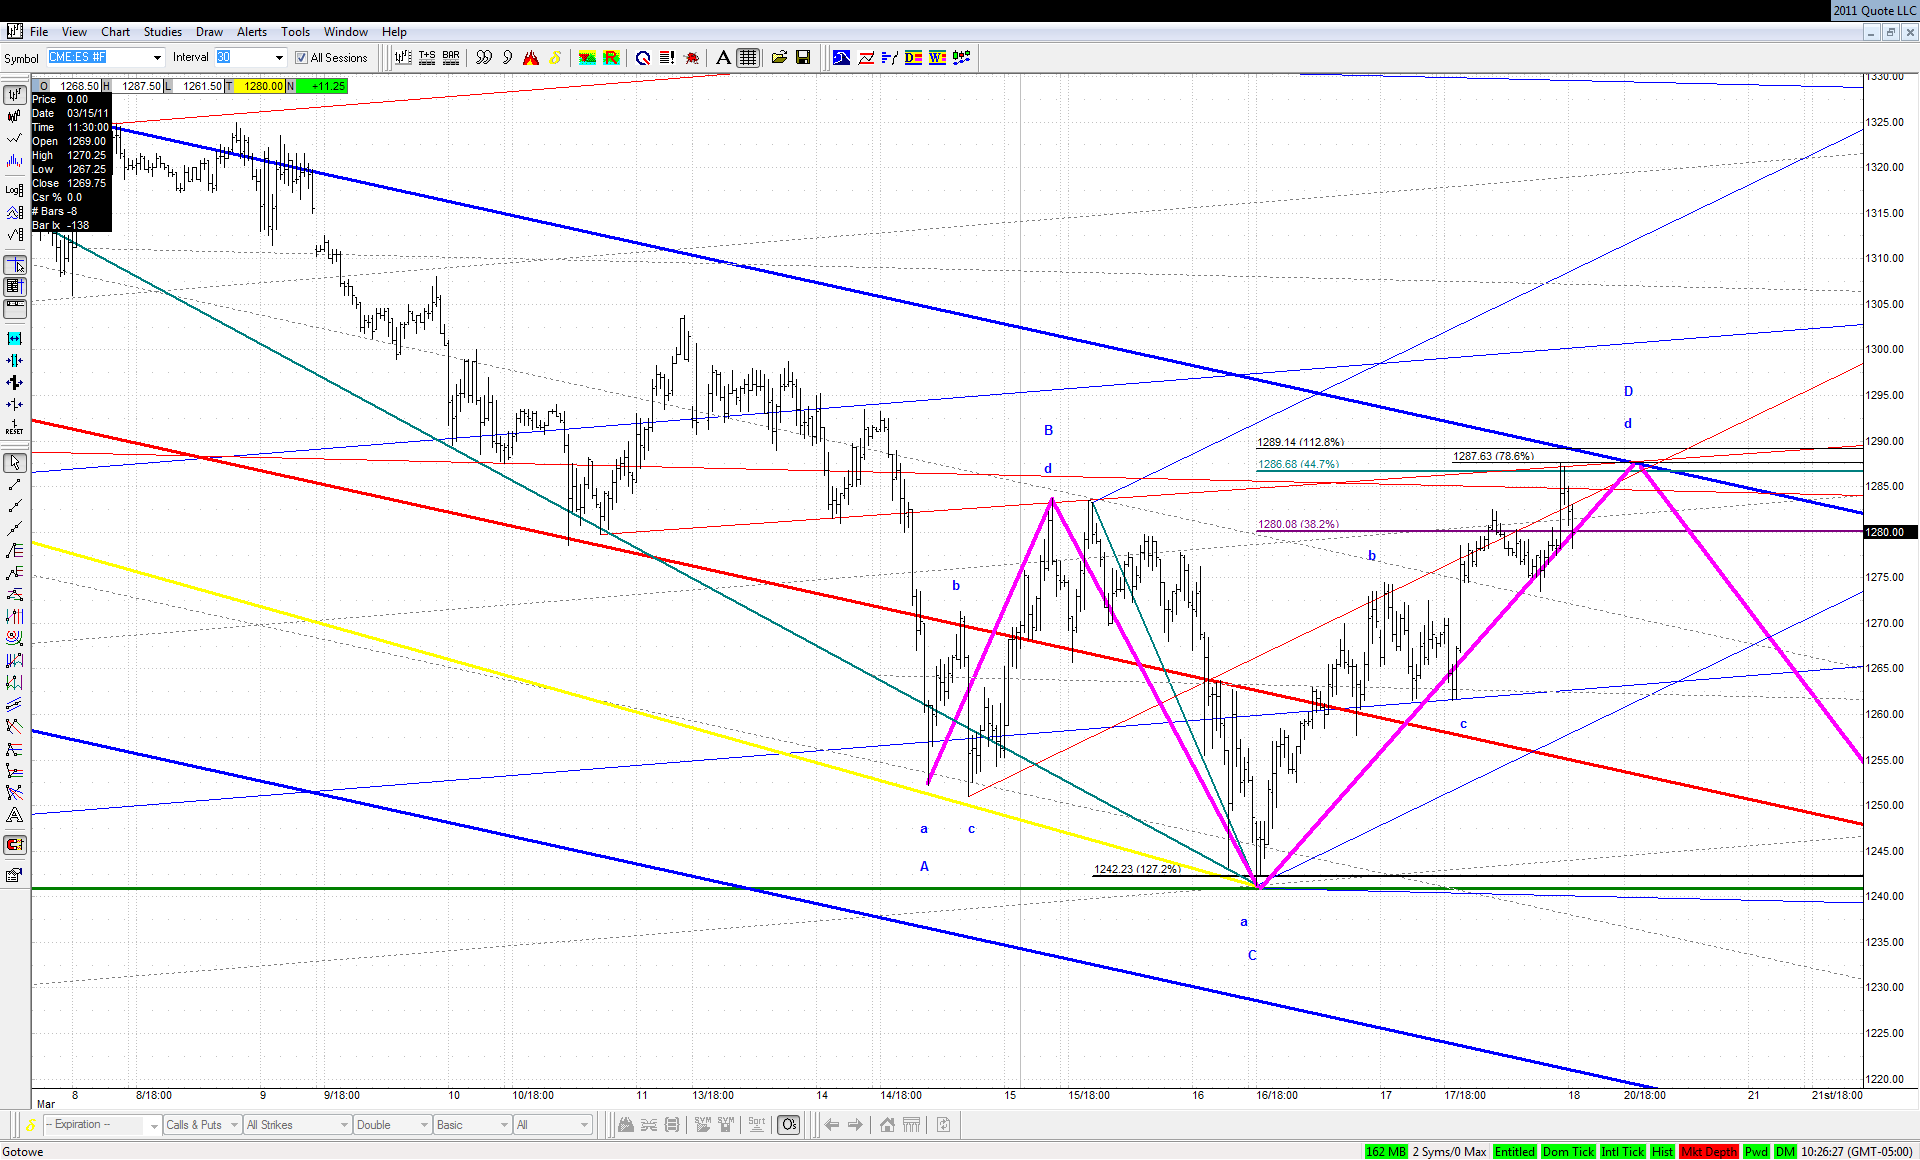
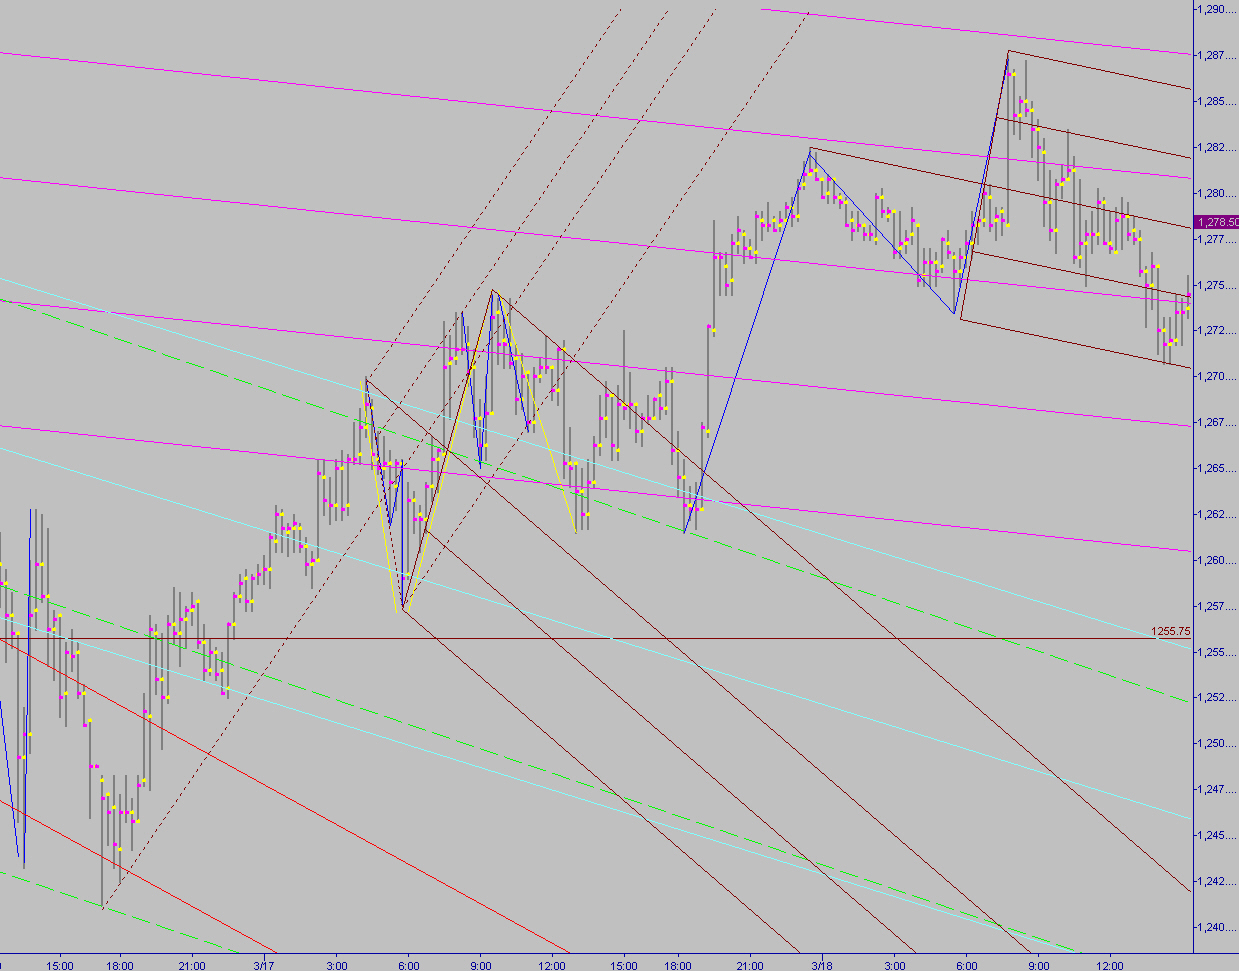
There is not much to add to the extensive coverage of the recent weeks here. While looking for geometry of Friday's turn on the continuous contract basis I came up with the following picture:
We have an almost ideal .382 bullish ABCD here. Thanks to Roofer's findings based on thousands of examples we know that probability of taking out the high equals in such case 87%. What's more in order to hit Jim's target zone at the line, a pretty fast move would be required... We'll see next week if we are on the right track and ... in the right train
JA
jarek
Rep: 94
Posts: 3,474
Originally posted by jarek
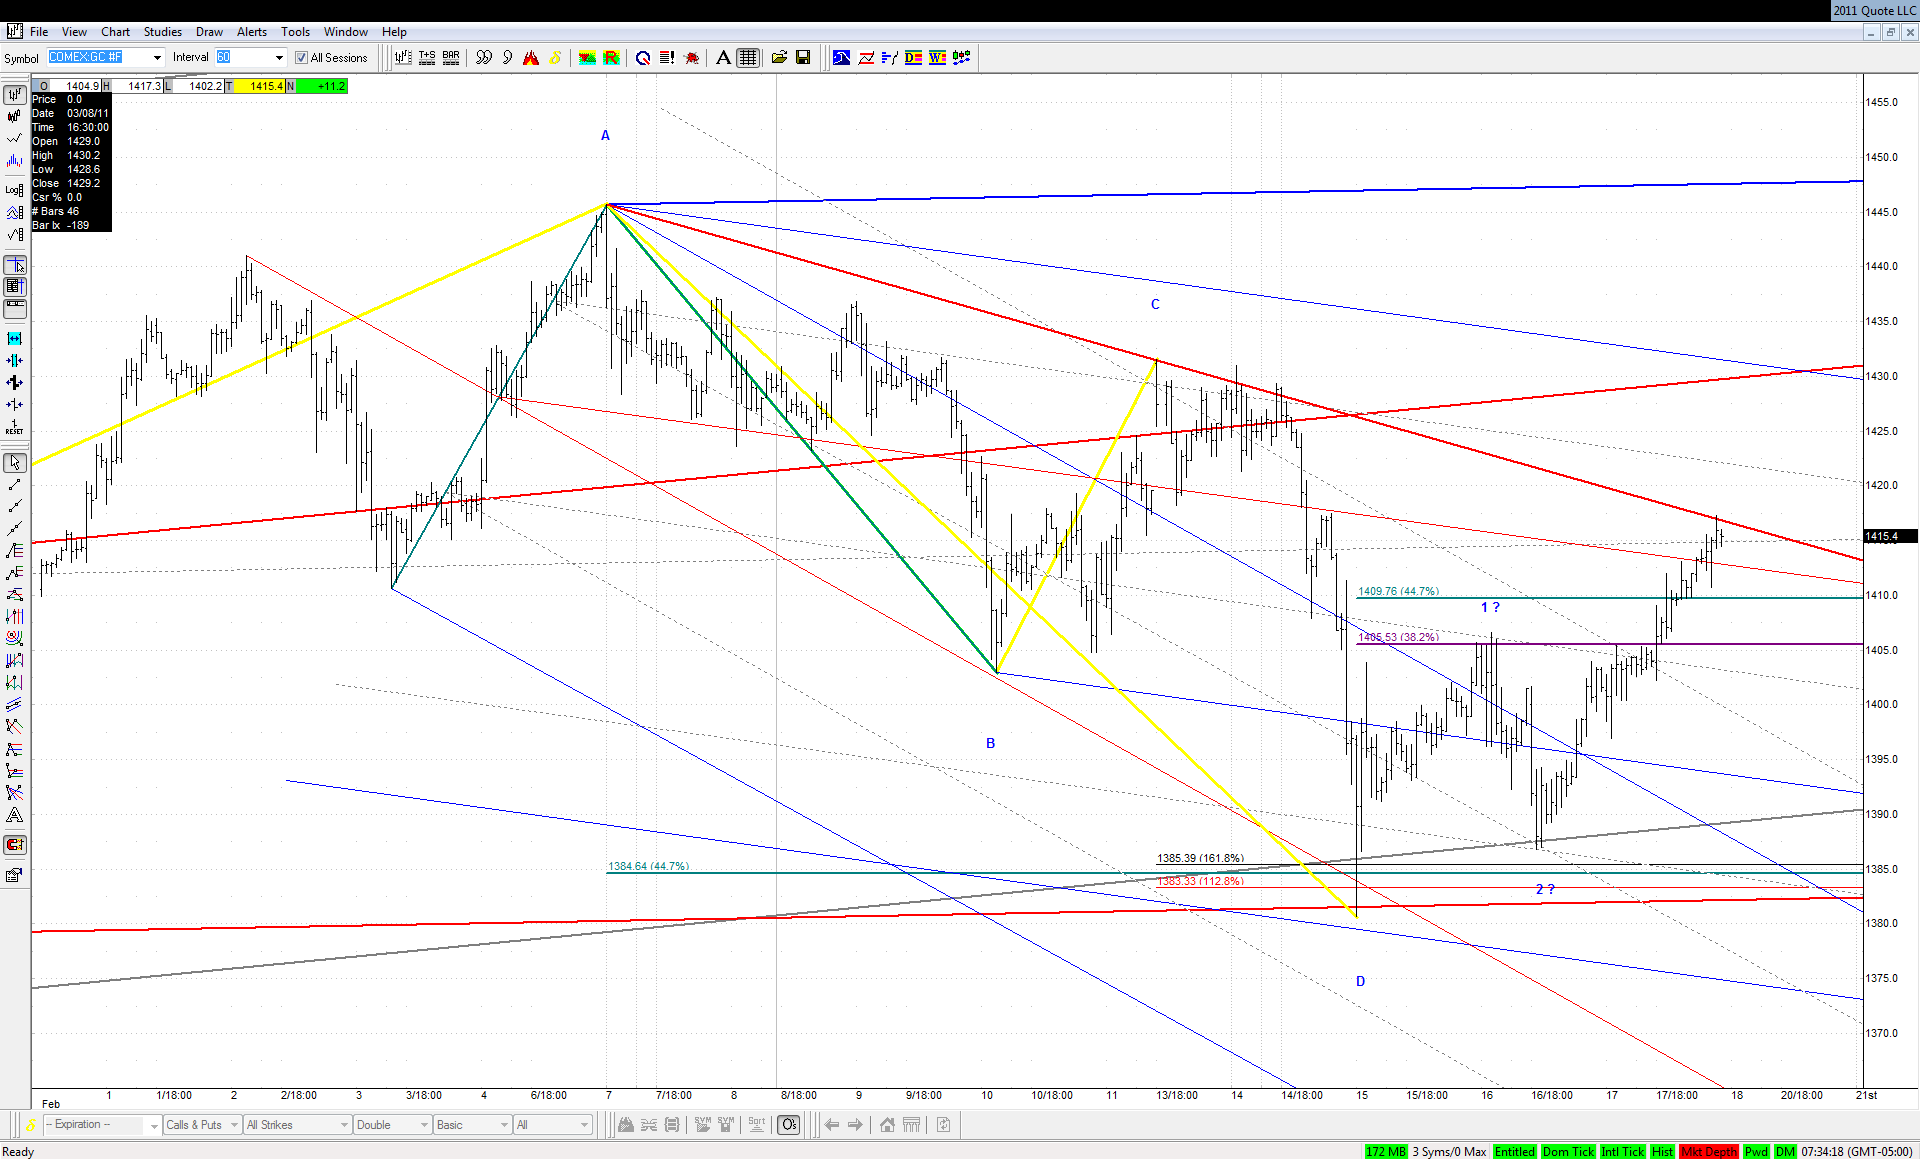
This is how real W3 behaves: if there is a geometry in the closest Kane Zone - it has to be respected...
And here is the proof that it is a 'real' W3:
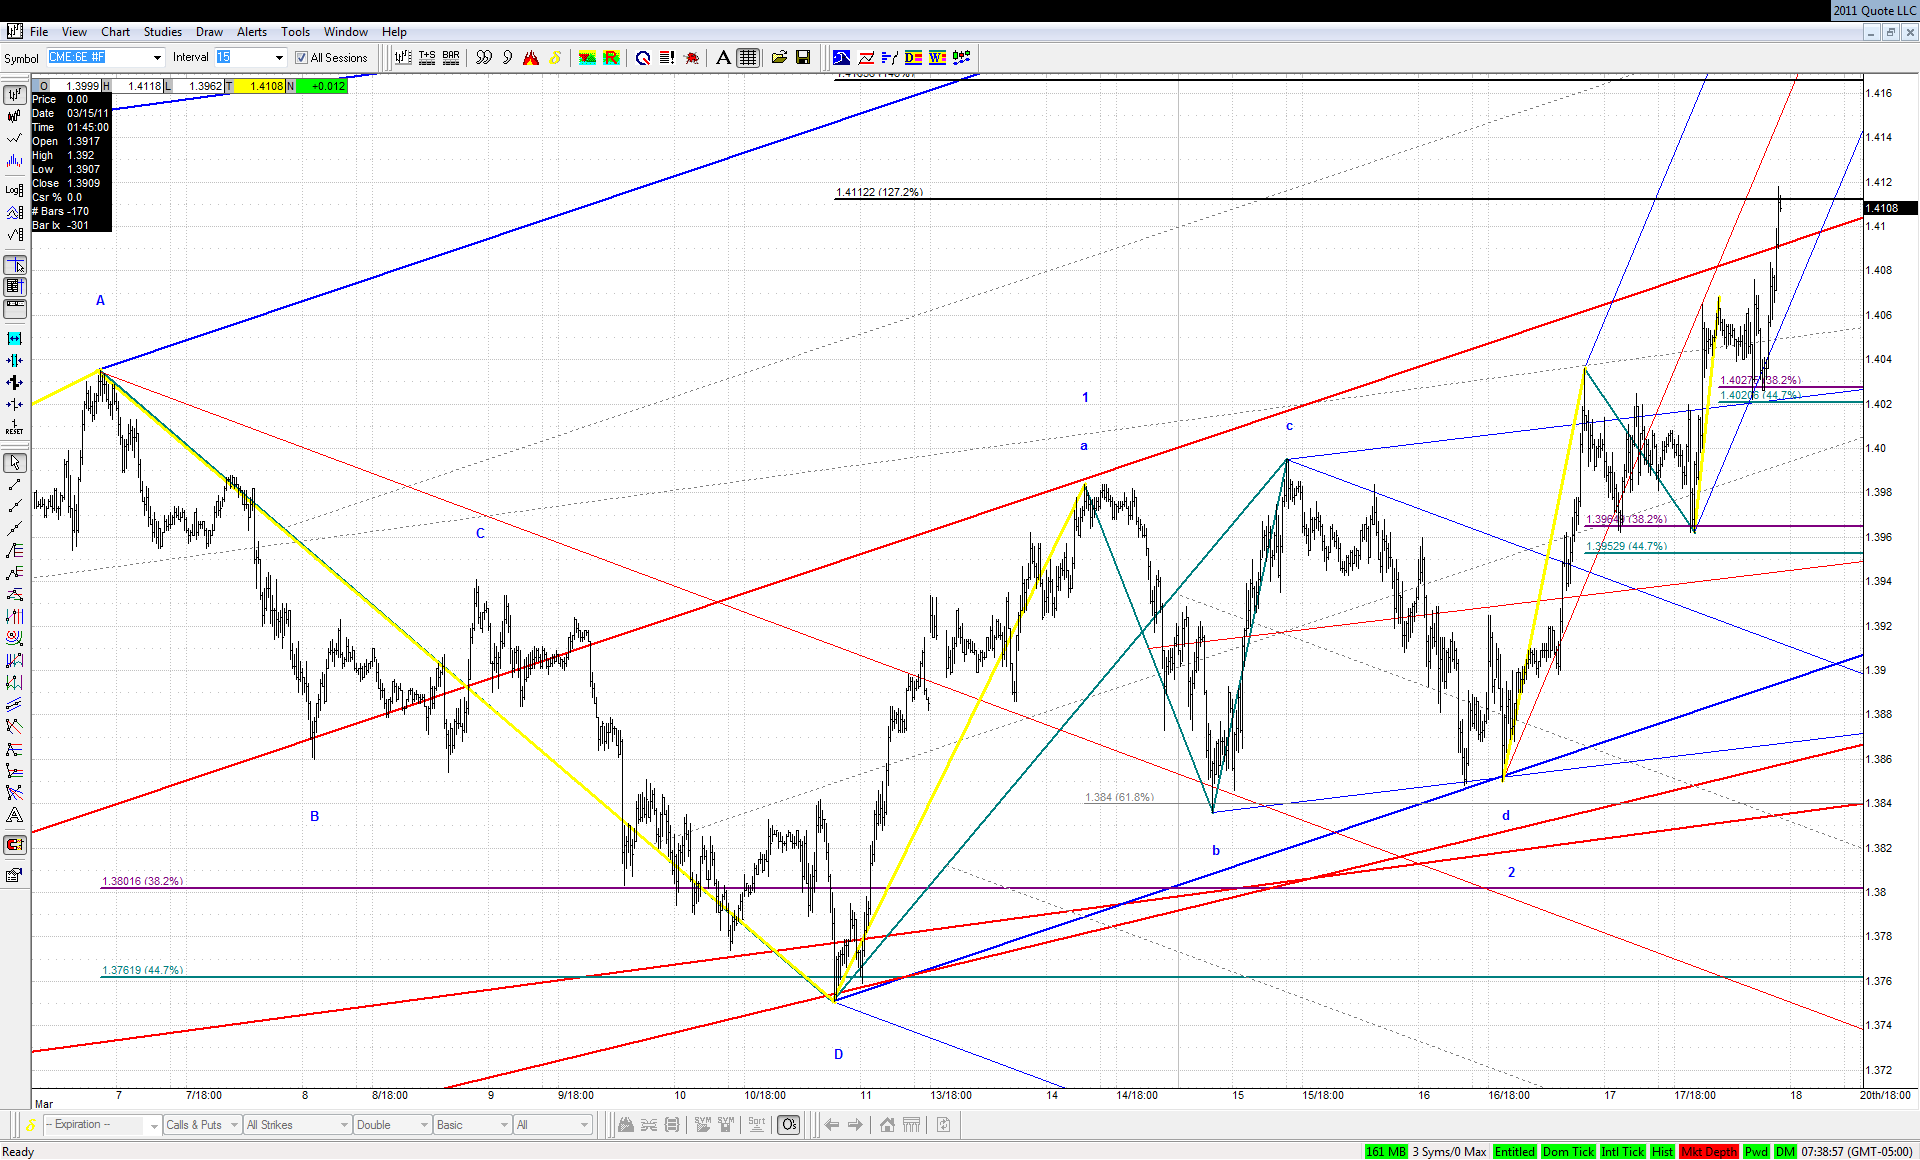
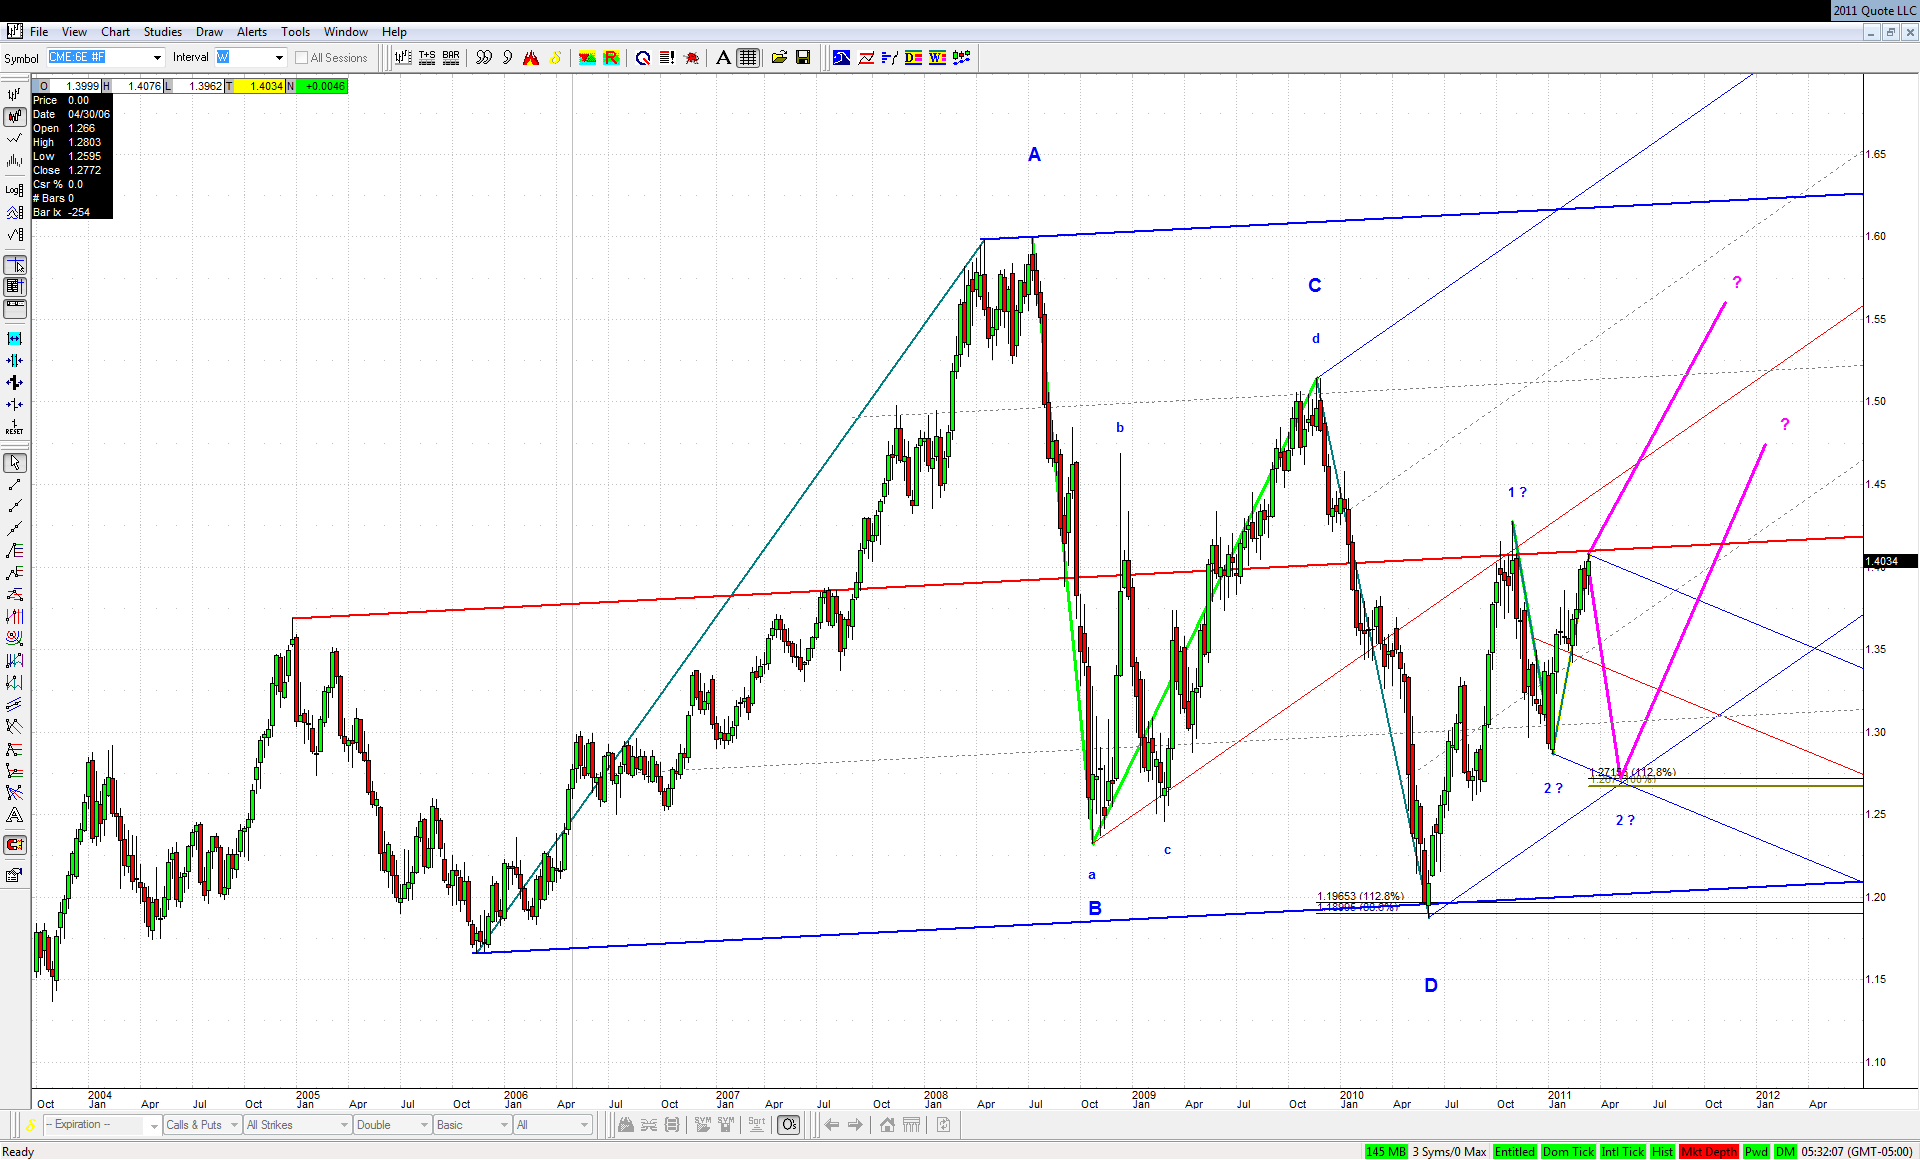
First target for the move of the bigger bullish ABCD was just met, but hence there is no line, the rise should continue.
Also when we recall this great RTH setup with 0.886 and test with retest, then we have yet another confirmation of the fact, that when great setups fail - they usually fail badly.
TX
tx_ches
Rep: -10
Posts: 514
Yep, it was really good trading.
Originally posted by rat89
quite the path to get there too
RA
rat89
Rep: 0
Posts: 7,015
that one is a beauty
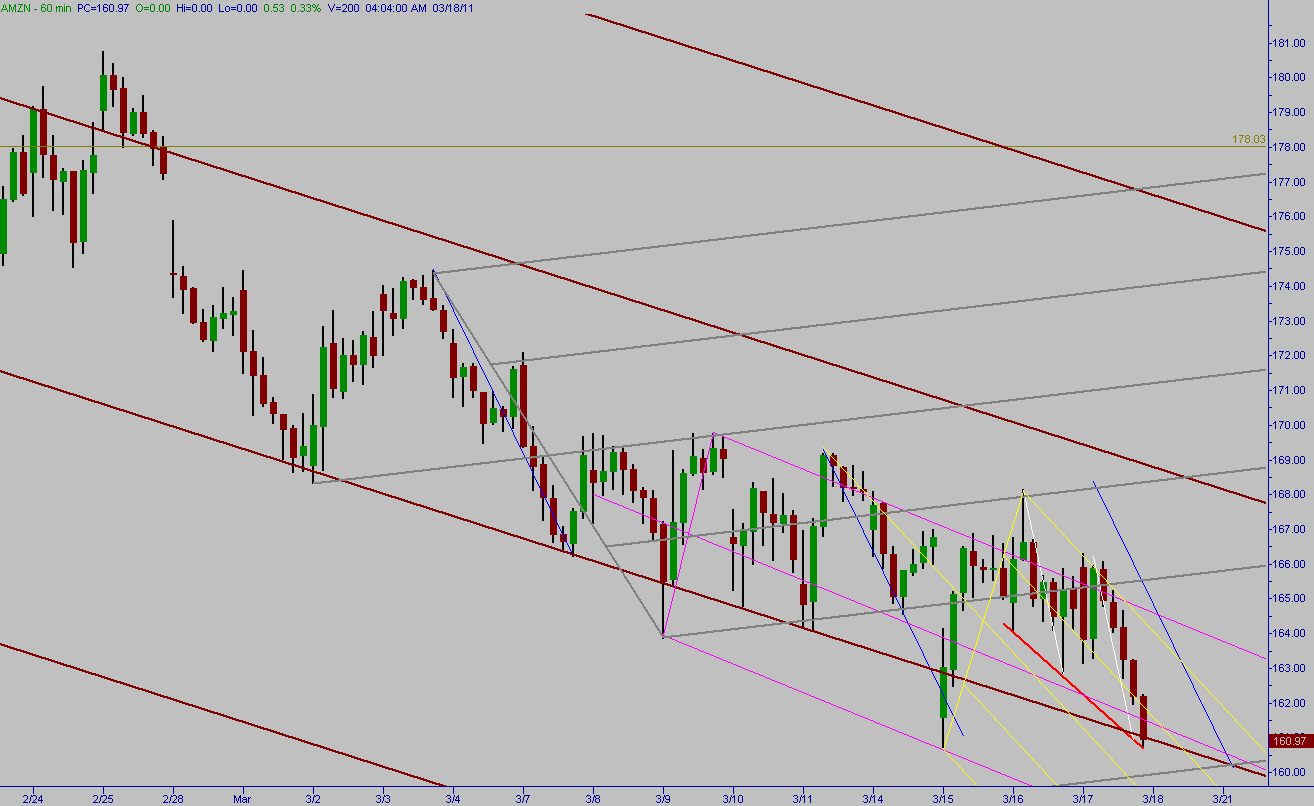
Originally posted by roofer
one from yesterday only a kane trader could appreciate