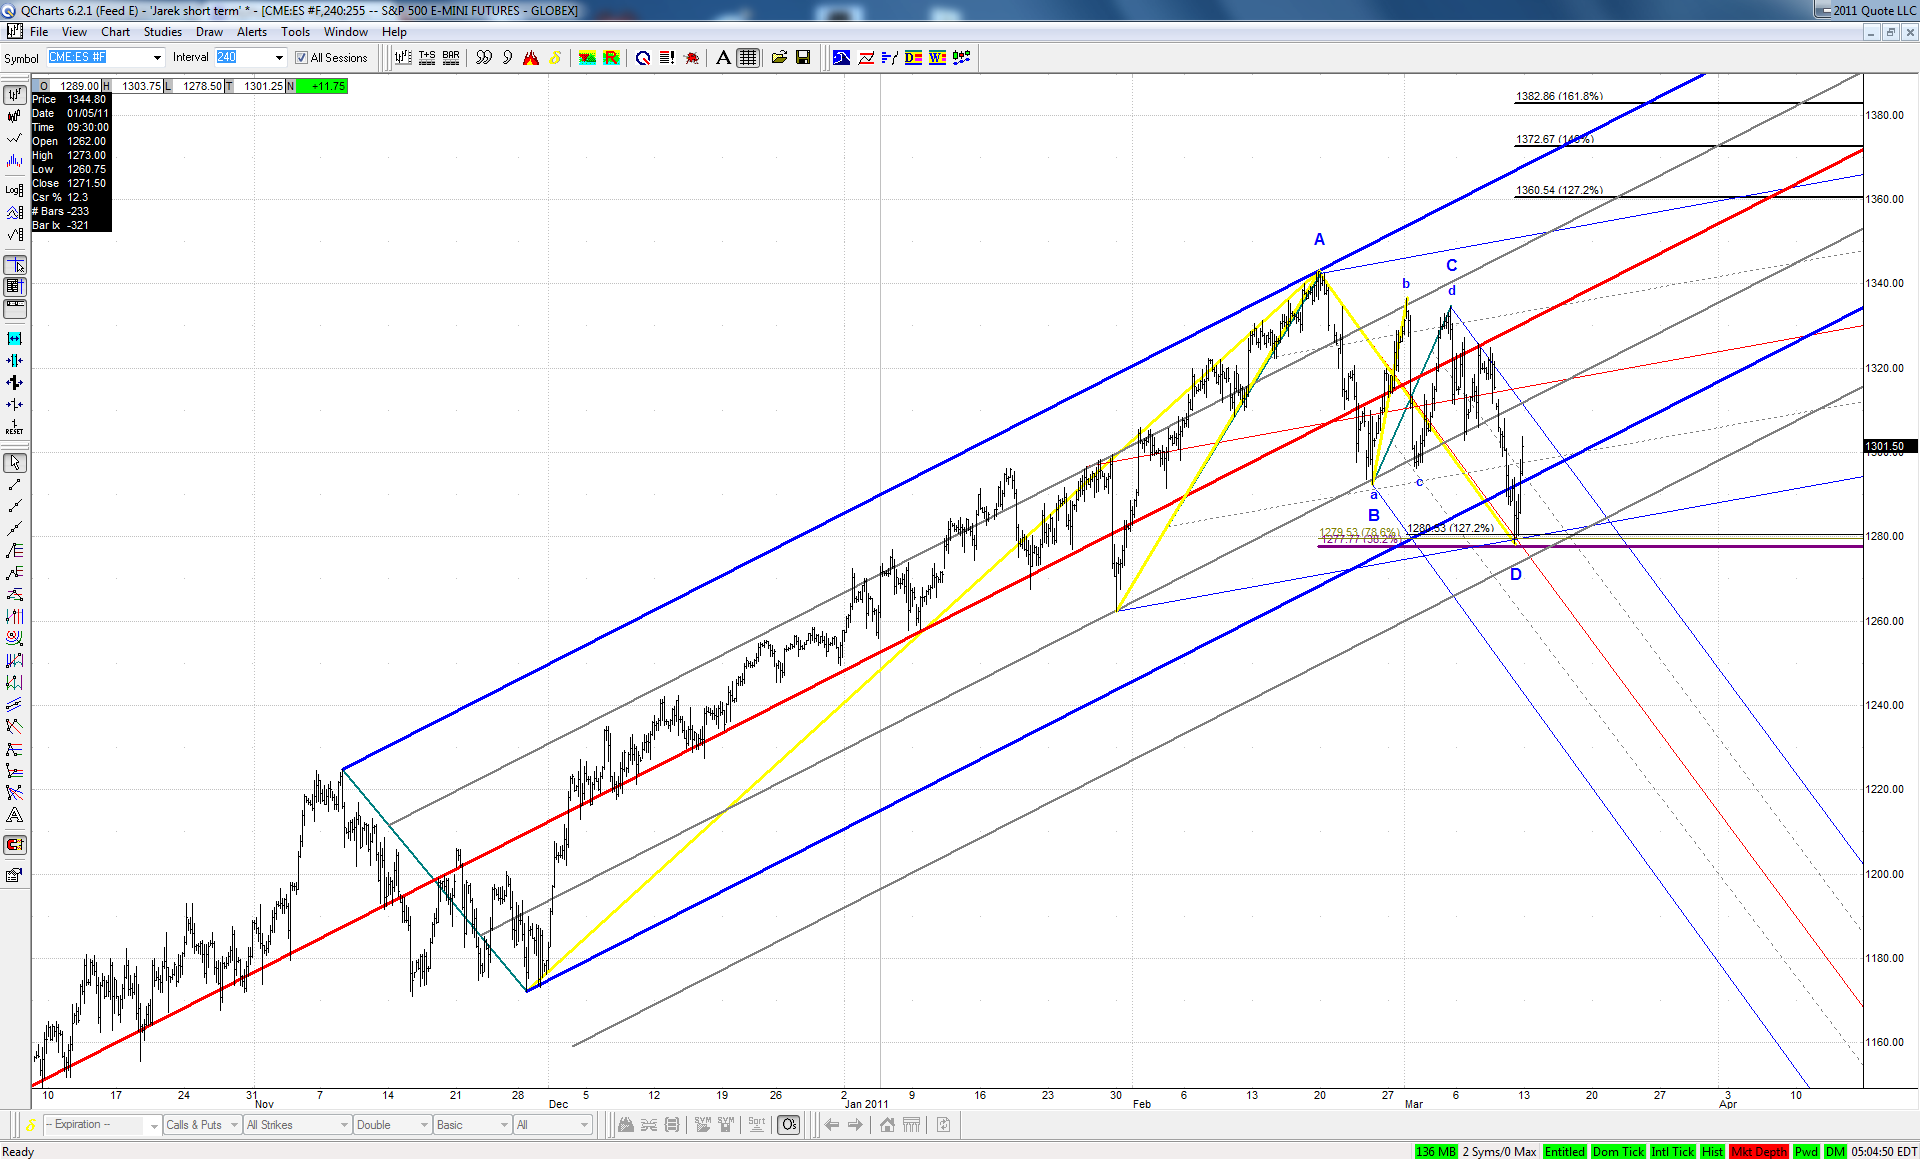
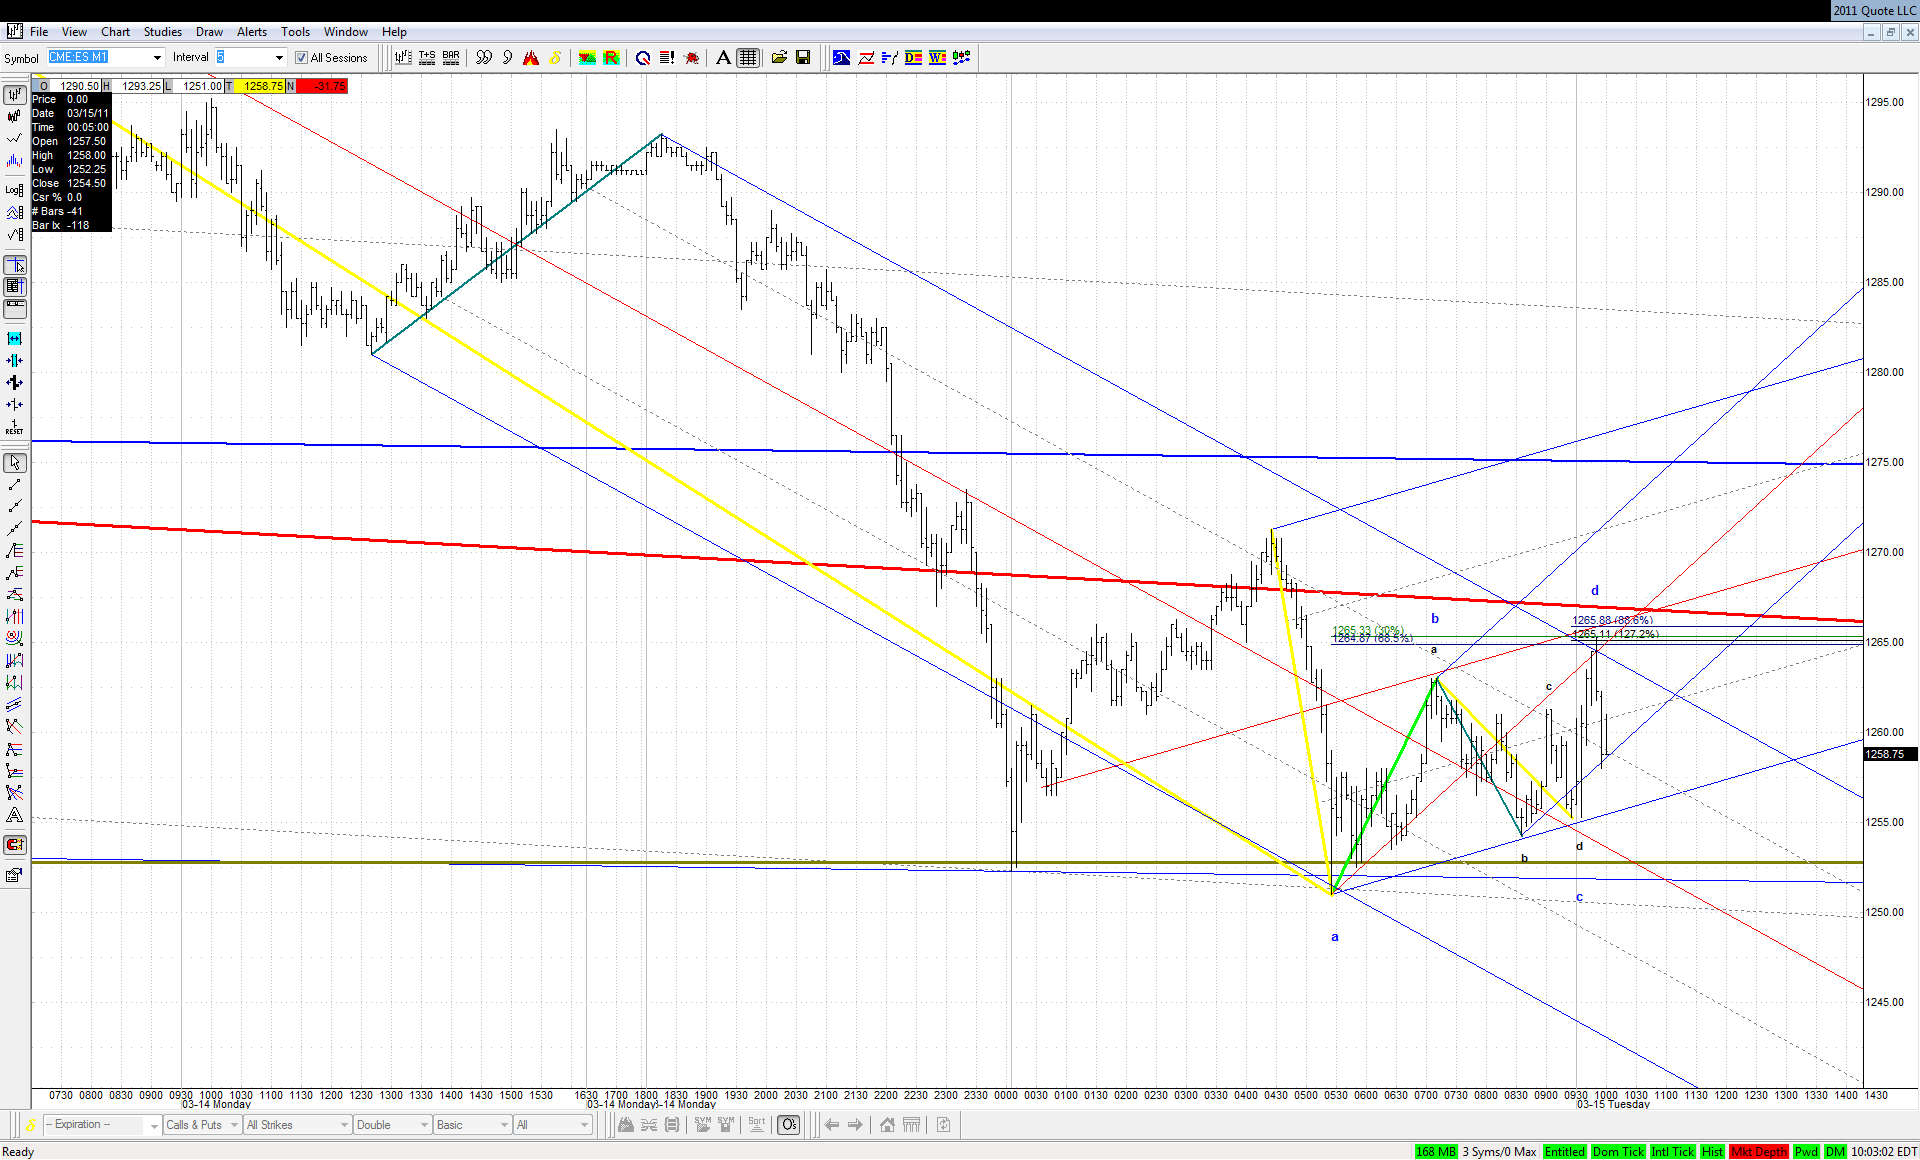
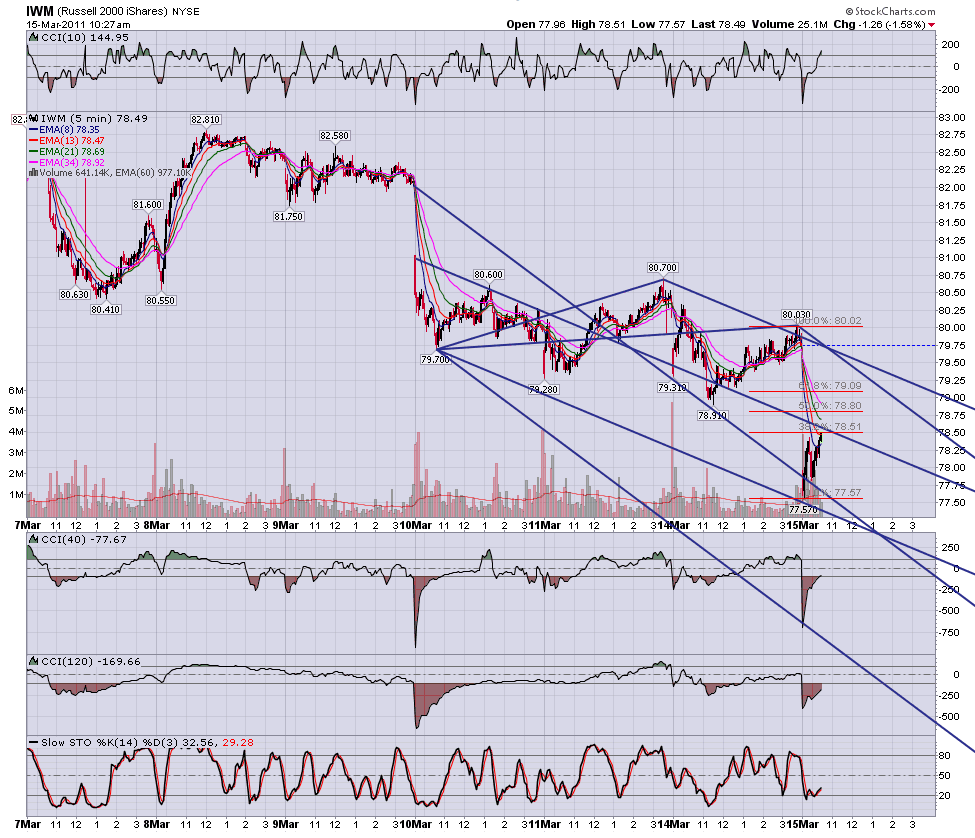
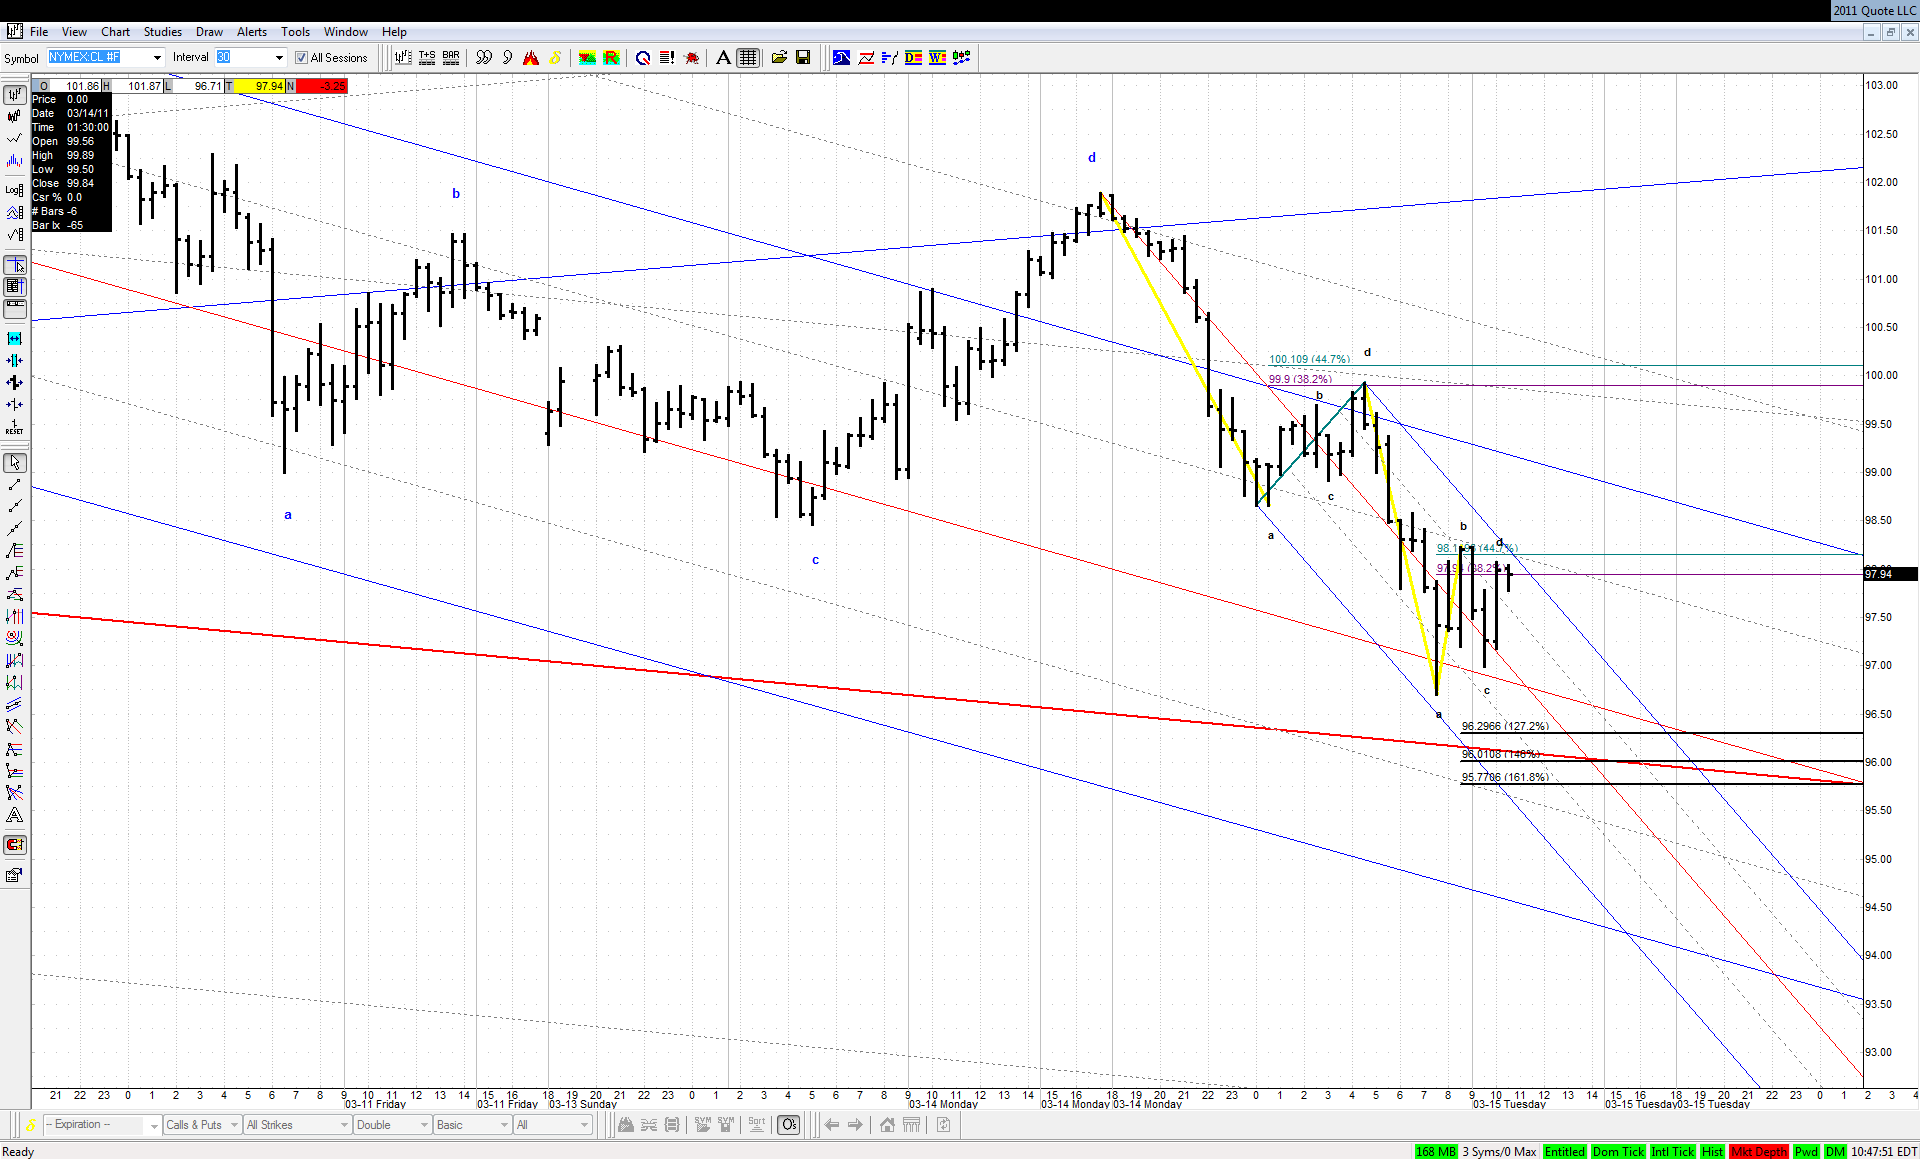
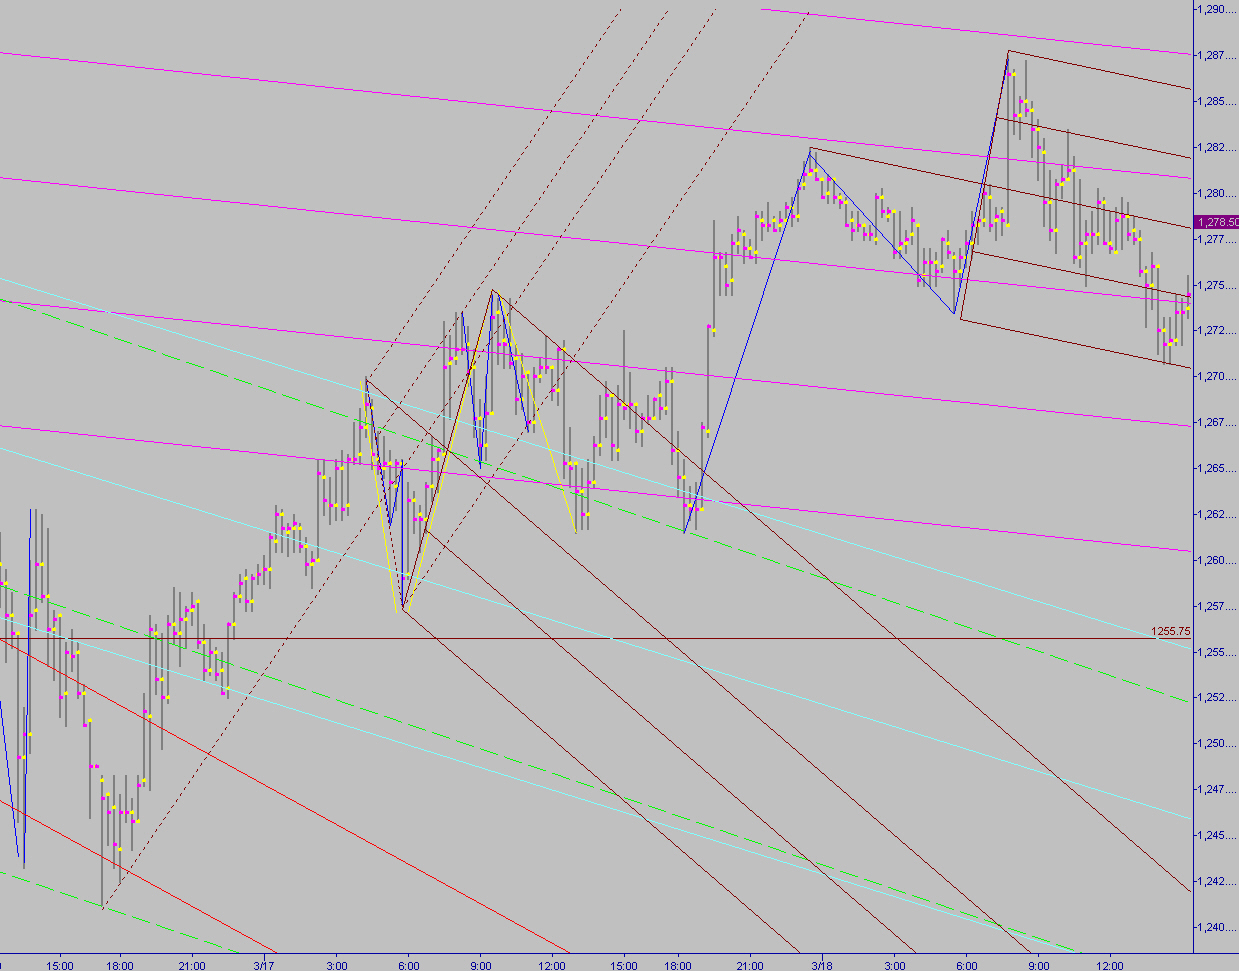
There is not much to add to the extensive coverage of the recent weeks here. While looking for geometry of Friday's turn on the continuous contract basis I came up with the following picture:
We have an almost ideal .382 bullish ABCD here. Thanks to Roofer's findings based on thousands of examples we know that probability of taking out the high equals in such case 87%. What's more in order to hit Jim's target zone at the line, a pretty fast move would be required... We'll see next week if we are on the right track and ... in the right train
RO
roofer
Rep: 3,689
Posts: 3,574
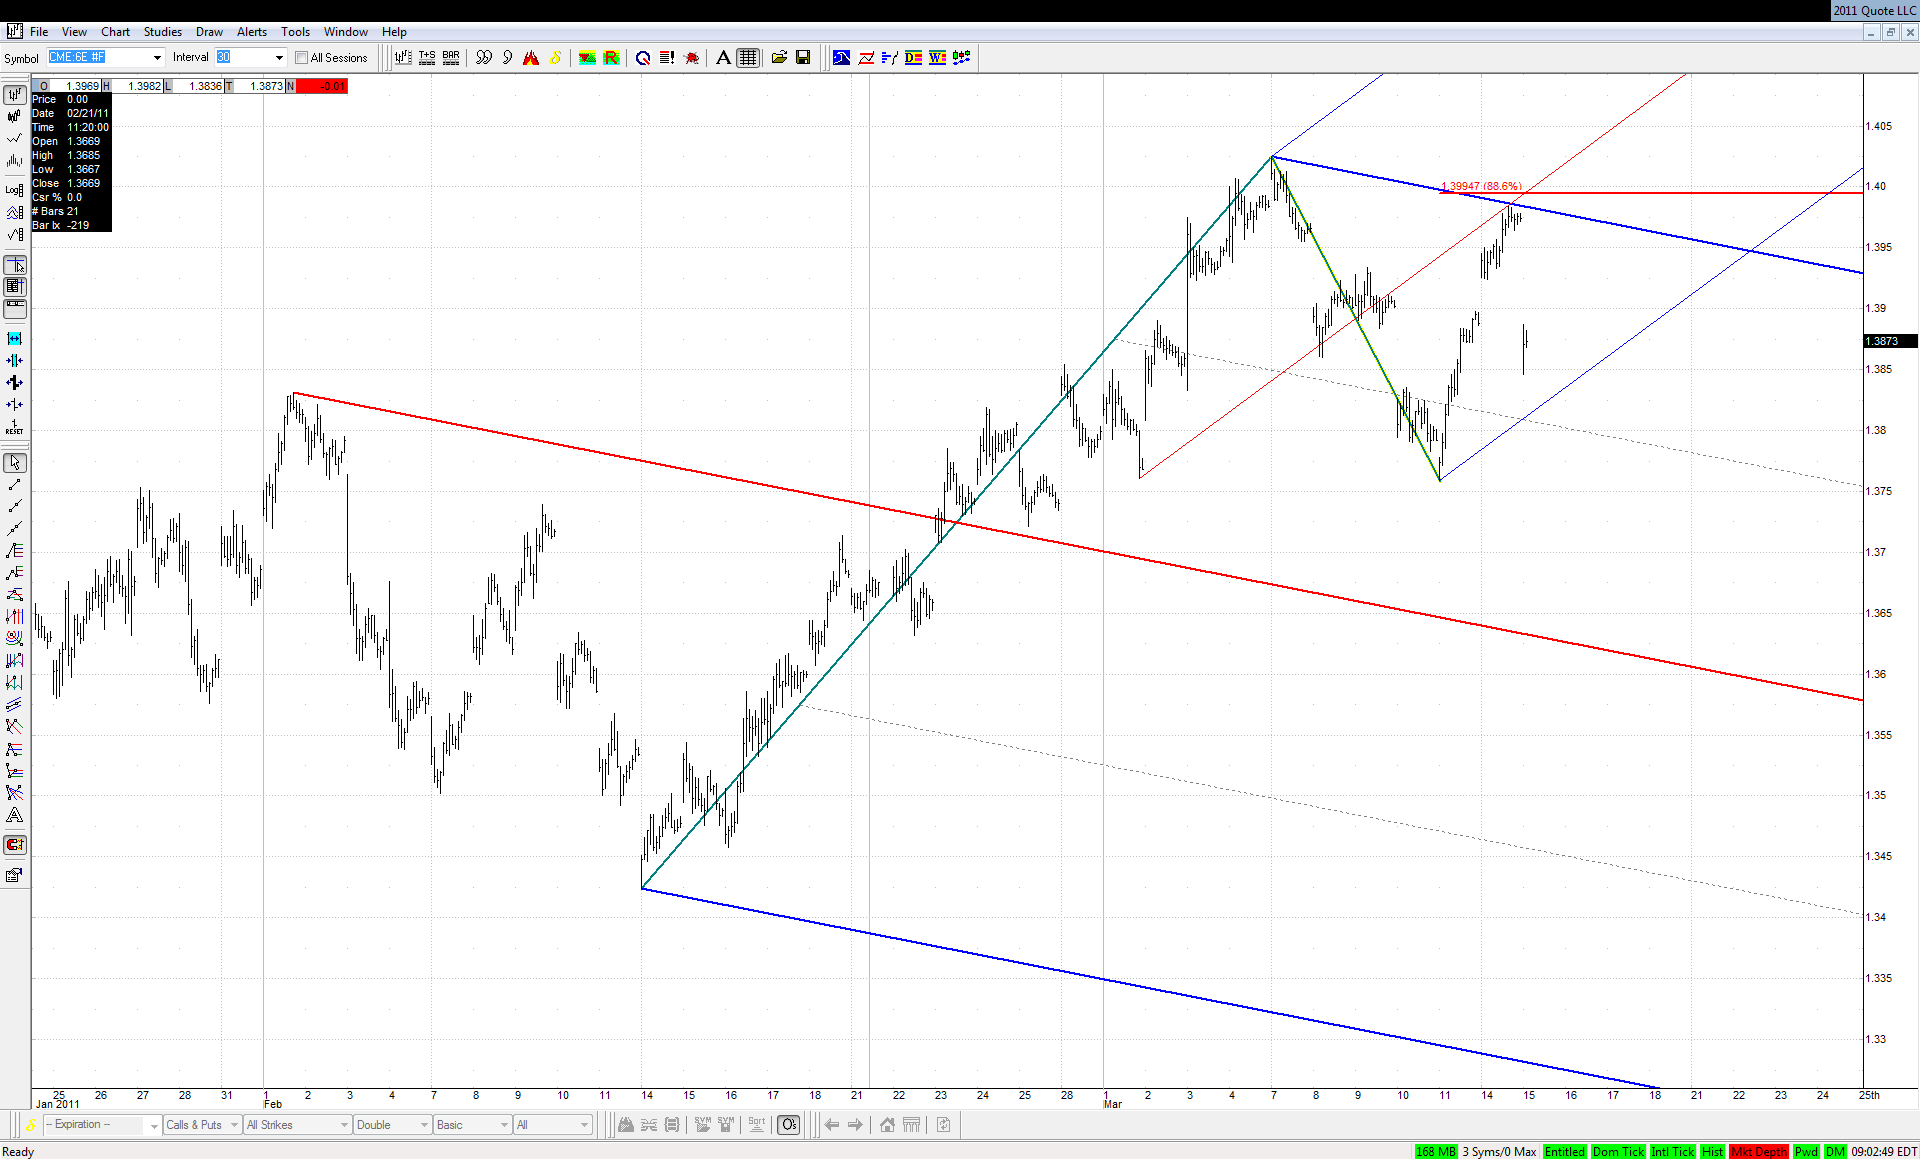
j- what your euro chart does not show was that yesterday's high was a .886 on gap on 5 at key downsloping line in rth
RA
rat89
Rep: 0
Posts: 7,015
a beautiful long setup, but the failure to get to the median line puts it in the failure category at the moment.....failed at .618 of larger move down.....support lines shown at .886, 1.128 and 1.27 might be of interest depending on the context when and if they are hit....
JA
jarek
Rep: 94
Posts: 3,474
Originally posted by jarek
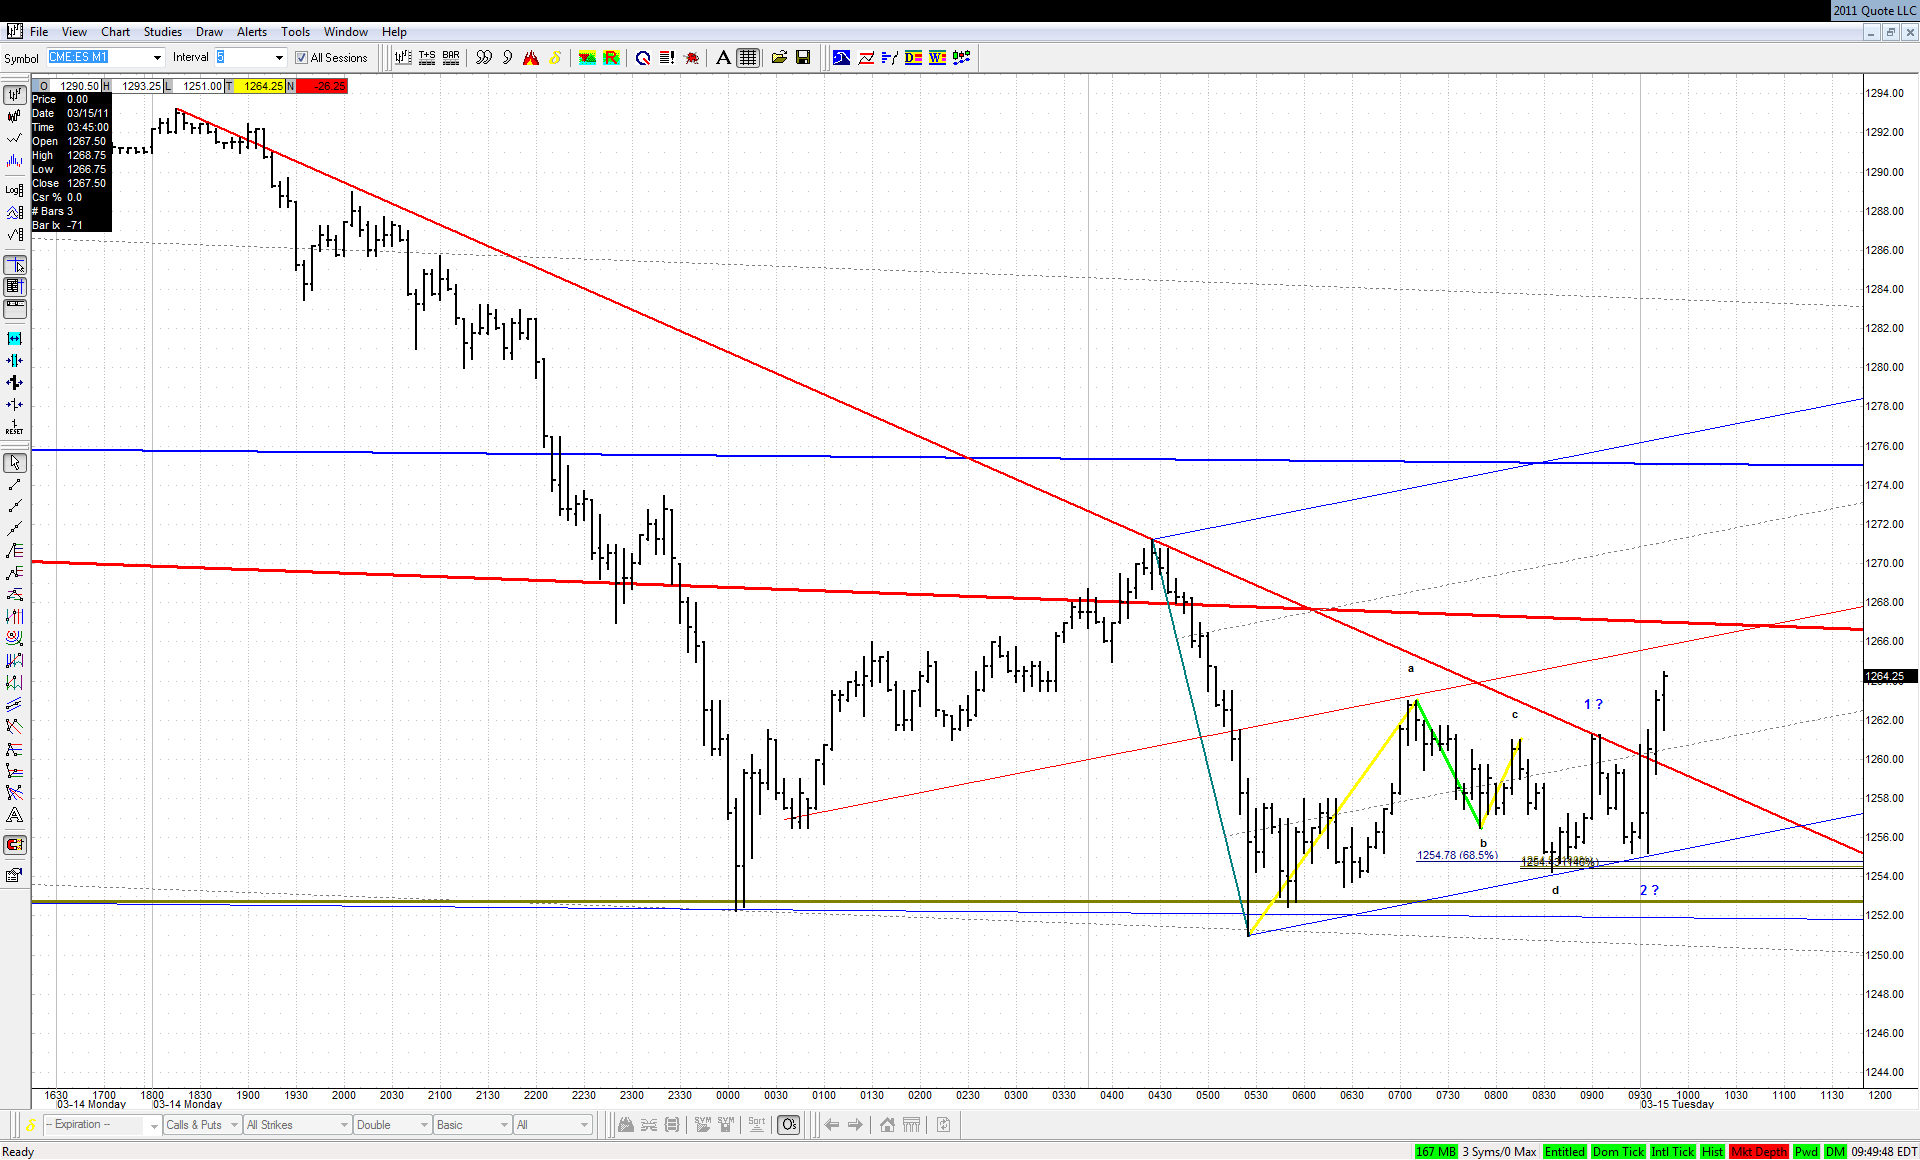
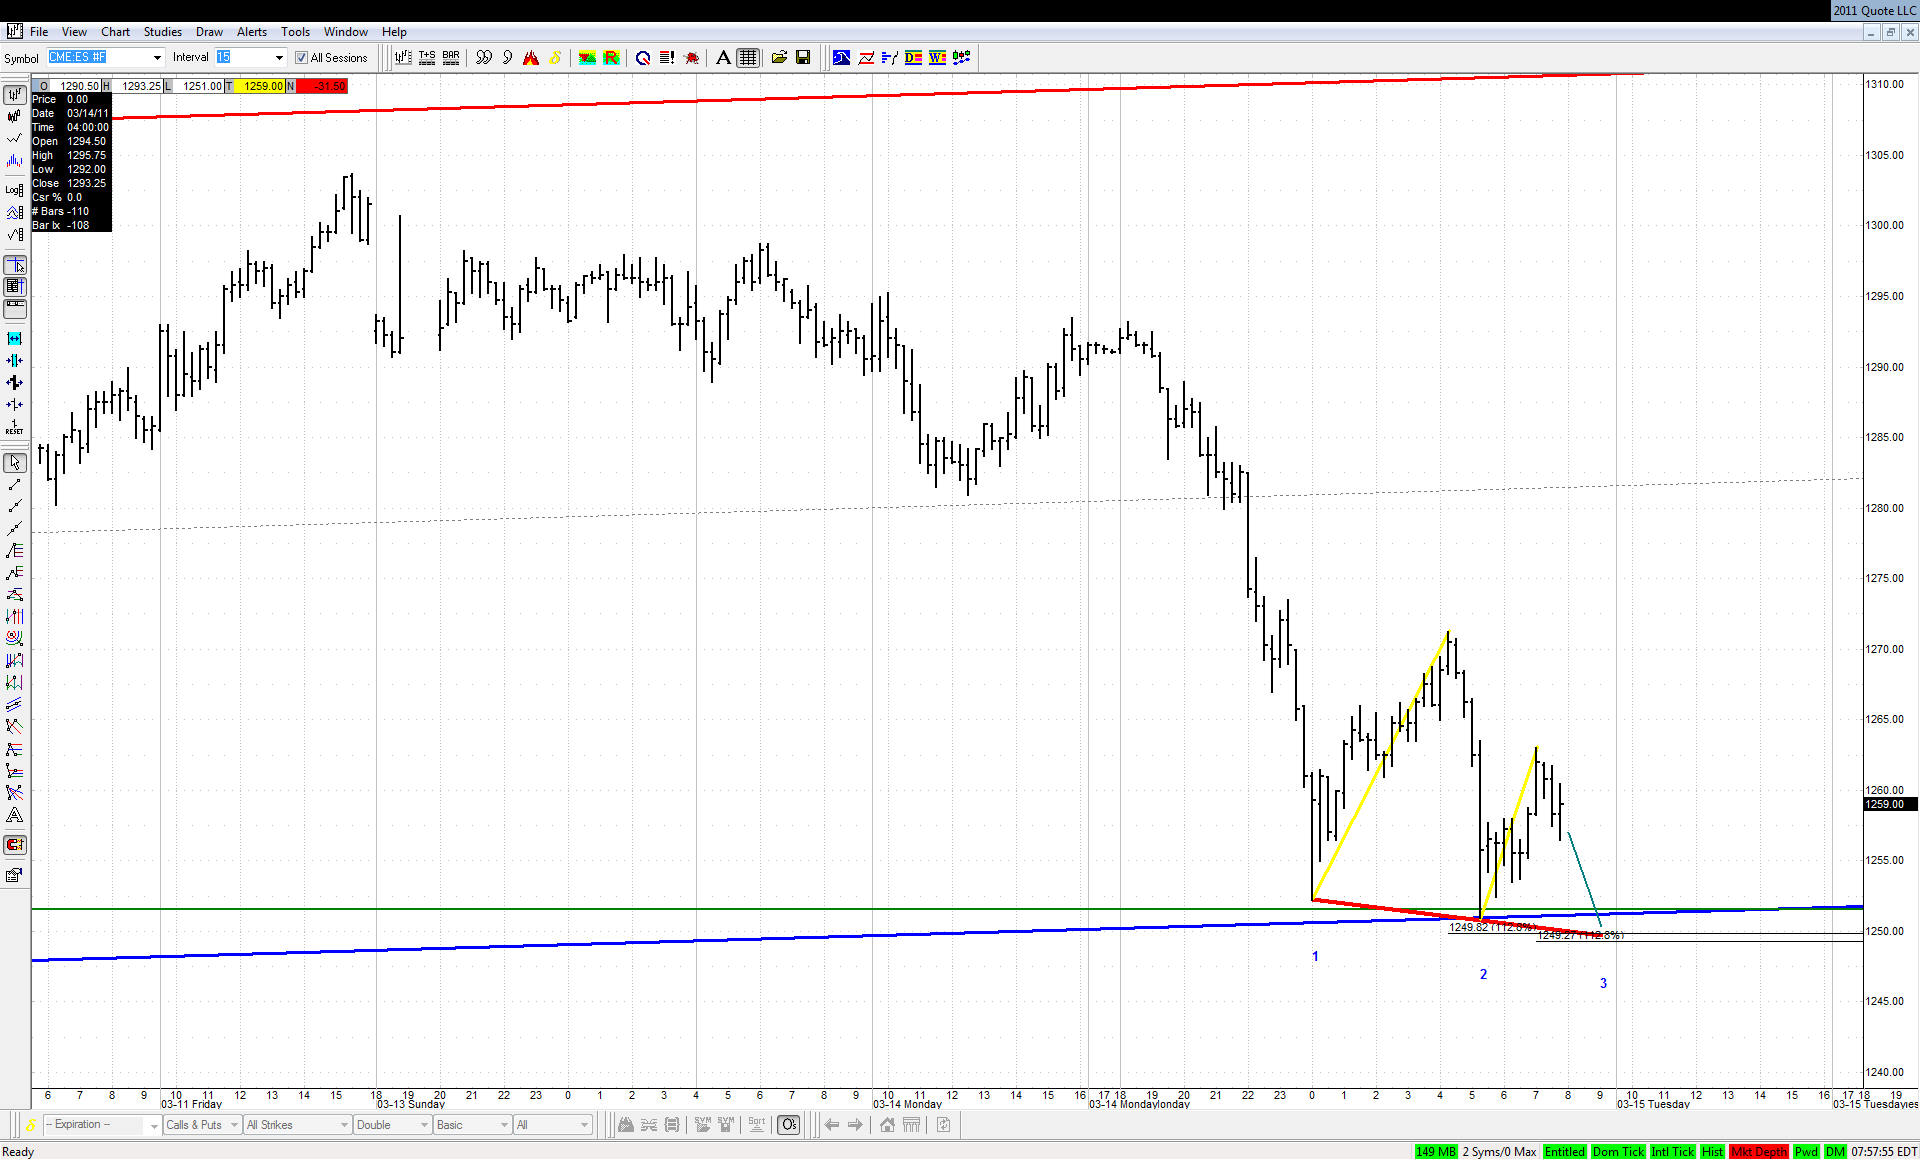
If ES declines just to a marginal new low around the open and starts bouncing from there, it would be a great looking 3D at a spike line, right at that upsloping lower ML from the longer term chart on continuous contract...
It was close, but didn't get there: