Lookin' Mixed to Even Nasty
Went thru the Daily charts of the SP-500 ... and ain't much to write home to mom about. In fact, many that have been "performing" are individually showing toppy chart activity and appearance. Also, ran my other scans and just didn't see much that looked good as potential LONG equity picks.
Obviously, there's the Double Toppy looking thing going on with the ES fwiw ... as we pushed up into that resistance and hit a brick wall for now. Anyway, here are the stocks that I plucked out of about a 1000 I viewed on both their Daily as well as their 5min intraday chart "look" and price action ... as it relates to long type setups/patterns and with heavy emphasis on R/S (strong) compared to the ES activity yday and the past few days/weeks:
PCLN
OPEN
APKT
CEVA
JAZZ
HUM
TZOO (this one's a mut&#! Focher)
Tossing these out as potential equity LONG plays if the market holds up and/or moves UP. But to revisit what I've continued to try and hammer out here ... is that this long pick group can function collectively as an INDICATOR for what the overall market is gonna do intraday ... at least for the first few hours ... and often the session. If they don't show any strength, show erratic bobble-head up/down price action ... or just fall off a cliff. Well, that's telling. Even with just 7 to work off of for Wednesday ... if the majority act like a bipolar etch-a-sketch jonesing for a vat of lithium ... then it's usually (not always, but usually) worth paying attention to. I'd encourage all to do the same with your own set of good long setups too. It really can be a read of MARKET INTERNALS.
And of course, we're coming into option expiration this week (which others have alluded to) that usually creates weird and unexpected cross-currents of noise on the ES and in stocks.
Hope these long picks and INDICATOR approach/idea is helpful to some folks out there!
Blathered so much that my Crown and Coke needs a straw for me to suck up the last nectar of the god's fumes at this point. Means a REFILL! Btw, if all of the "observers" out there that aren't comfortable posting yet, well POST in the ES daily room. Bruce, Paul, Lorn, PT, BeyondMP etc. and some new great poster inputs offer some seriously incredible calls and detailed education that I've not seen anywhere else on the internet free or for-fee!
I'm MonkeyMeat and I approve this message
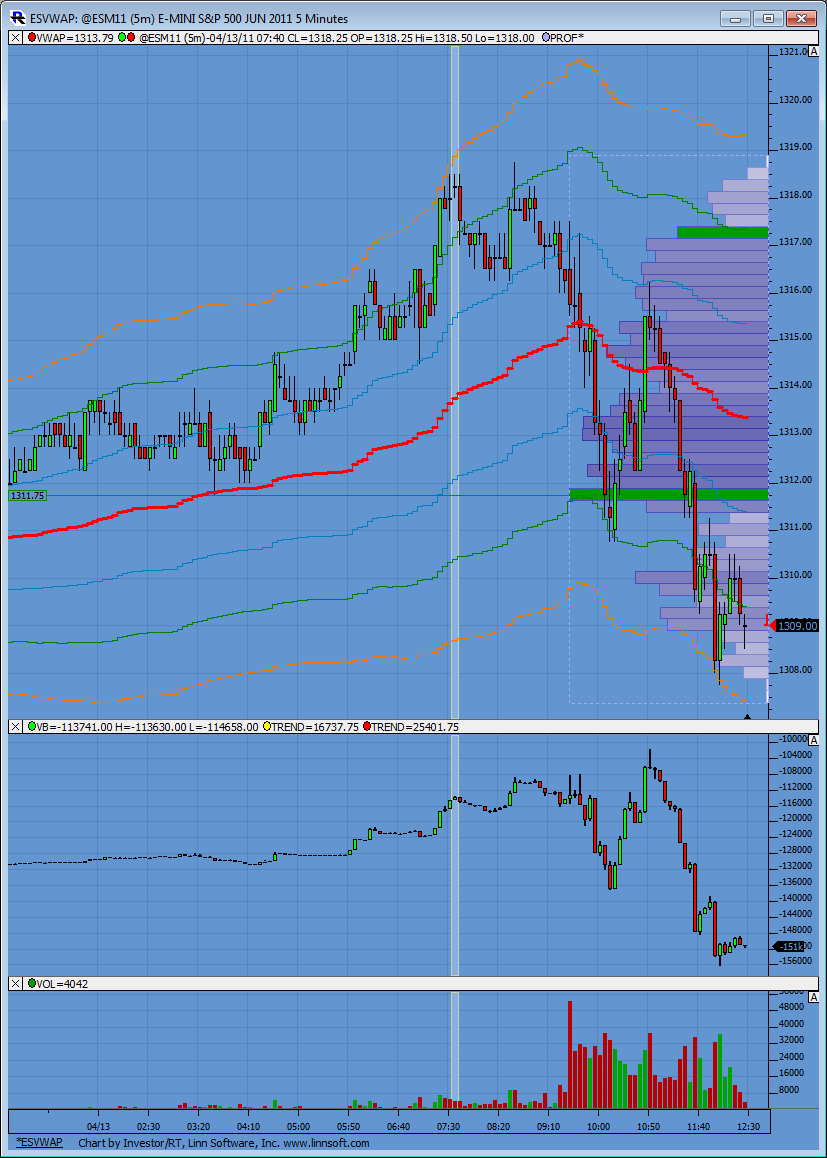
as it did yesterday, the 308 area holding the line here for now, as well as the 200 level in ym...if those are taken out i think we are destined to revisit yesterday's lows...and it so happens that some of my medium term projections also fall in the area (305.5 or so); btw 170 is the next decent support in ym so some 30 points or so from where we are as i write (around the 200 level) so some 3-3.5 points from the current es level 308.5 (which hints at the 305 area too)...
shoot...by the time i finished elaborating my train of thought we were already there !
Originally posted by apk781
as it did yesterday, the 308 area holding the line here for now, as well as the 200 level in ym...if those are taken out i think we are destined to revisit yesterday's lows...and it so happens that some of my medium term projections also fall in the area (305.5 or so); btw 170 is the next decent support in ym so some 30 points or so from where we are as i write (around the 200 level) so some 3-3.5 points from the current es level 308.5 (which hints at the 305 area too)...
I'm trying to get long under and after we break YD rth lows.....thinking they may try to come back up for the 08 area...prefereably in the 05 - 03 area.....
we have Pauls projection method down at the 1303 too ..just an FYI
twice the IB is down near 1303 too...
we have Pauls projection method down at the 1303 too ..just an FYI
twice the IB is down near 1303 too...
long from 5.25...will take half off at 7.25 and the other half at 8.25...stop 2 pts (will move to b/e if first target is hit)
and look at the pure volume ( lower pane on your chart)when we have those tight bars....it also has contracted... a nice clue....getting both of those conditions together is nice confluence....
Originally posted by Lorn
One more for good measure. Notice on each rebound in price the CD bar is small/tight while all the declining bars are long and taking out the previous low.
In the midst of a bounce off yesterday's close and the O/N low.
Click image for original size
first target hit, stop to b/e here now...
Originally posted by apk781
long from 5.25...will take half off at 7.25 and the other half at 8.25...stop 2 pts (will move to b/e if first target is hit)
I'm with ya but from 05.75...nice little divergence on the lows of Yesterday..with volume and $tick...my first target is the 07.75...not convinced this is the last test though...volume is poor on the rally up
Originally posted by apk781
long from 5.25...will take half off at 7.25 and the other half at 8.25...stop 2 pts (will move to b/e if first target is hit)
nice trade.!!!
Originally posted by apk781
first target hit, stop to b/e here now...
Originally posted by apk781
long from 5.25...will take half off at 7.25 and the other half at 8.25...stop 2 pts (will move to b/e if first target is hit)
second target hit here, flat now
[/quote]
Originally posted by apk781
long from 5.25...will take half off at 7.25 and the other half at 8.25...stop 2 pts (will move to b/e if first target is hit)
[/quote]
final off at 08.75...flat now.....Love when they get below those nodes when trade starts out above....
So all those traders get long near 08.50 as that is what some vendors teach them.....then they get stopped out when it goes 2 -3 points under the number.......and once all those buyers have sold out to cover for the loss there are no real sellers left to push the market down further......so the market rises...!!! This gets back to what BeyondMP mentioned the other day .....How do we really know when it is real sellers or just folks covering
Hopefully some can understand that babble and the logic to it!!!Not being big headed but that really is a critical idea...
Most of the 7 equity picks did decently (although erratically on a few) from the LONG side. And the ES ended up selling down. I know I've talked about the LONG PICKS as an "indicator." Some days they don't necessarily show as "internals" what the market's propensity for direction on the session is. But that's more uncommon than not. If anyone nabbed a decent one for a semi-decent stock trade ... then that's a good thang. But ... well, HELL! To get into the nuances of when and where to get into a stock isn't the place here. I can only trust that the group of 7 long picks didn't jig anyone out of a decent ES trade. At the same time, almost all of those Motor Scooters are still showing some great Daily AND 5min intraday action long. BUT ... as I've always alluded to when it comes to probabilities, the SP should "behave" ... in other words, not sell off like it did today. The fact that these stocks held up well in a weak market (expiry week factored in) ... may be xome serious great trades long if the overall market (ES) decides to bounce/rally.
Just a Monkey following up on the prior posts and explanations.
Hooot!
Just a Monkey following up on the prior posts and explanations.
Hooot!
Originally posted by MonkeyMeat
Went thru the Daily charts of the SP-500 ... and ain't much to write home to mom about. In fact, many that have been "performing" are individually showing toppy chart activity and appearance. Also, ran my other scans and just didn't see much that looked good as potential LONG equity picks.
Obviously, there's the Double Toppy looking thing going on with the ES fwiw ... as we pushed up into that resistance and hit a brick wall for now. Anyway, here are the stocks that I plucked out of about a 1000 I viewed on both their Daily as well as their 5min intraday chart "look" and price action ... as it relates to long type setups/patterns and with heavy emphasis on R/S (strong) compared to the ES activity yday and the past few days/weeks:
PCLN
OPEN
APKT
CEVA
JAZZ
HUM
TZOO (this one's a mut&#! Focher)
Tossing these out as potential equity LONG plays if the market holds up and/or moves UP. But to revisit what I've continued to try and hammer out here ... is that this long pick group can function collectively as an INDICATOR for what the overall market is gonna do intraday ... at least for the first few hours ... and often the session. If they don't show any strength, show erratic bobble-head up/down price action ... or just fall off a cliff. Well, that's telling. Even with just 7 to work off of for Wednesday ... if the majority act like a bipolar etch-a-sketch jonesing for a vat of lithium ... then it's usually (not always, but usually) worth paying attention to. I'd encourage all to do the same with your own set of good long setups too. It really can be a read of MARKET INTERNALS.
And of course, we're coming into option expiration this week (which others have alluded to) that usually creates weird and unexpected cross-currents of noise on the ES and in stocks.
Hope these long picks and INDICATOR approach/idea is helpful to some folks out there!
Blathered so much that my Crown and Coke needs a straw for me to suck up the last nectar of the god's fumes at this point. Means a REFILL! Btw, if all of the "observers" out there that aren't comfortable posting yet, well POST in the ES daily room. Bruce, Paul, Lorn, PT, BeyondMP etc. and some new great poster inputs offer some seriously incredible calls and detailed education that I've not seen anywhere else on the internet free or for-fee!
I'm MonkeyMeat and I approve this message
Emini Day Trading /
Daily Notes /
Forecast /
Economic Events /
Search /
Terms and Conditions /
Disclaimer /
Books /
Online Books /
Site Map /
Contact /
Privacy Policy /
Links /
About /
Day Trading Forum /
Investment Calculators /
Pivot Point Calculator /
Market Profile Generator /
Fibonacci Calculator /
Mailing List /
Advertise Here /
Articles /
Financial Terms /
Brokers /
Software /
Holidays /
Stock Split Calendar /
Mortgage Calculator /
Donate
Copyright © 2004-2023, MyPivots. All rights reserved.
Copyright © 2004-2023, MyPivots. All rights reserved.