ES Thursday 11-27-2011
The objective for today is at 1265.00 possible spike to 1279.00 but not necessary .
An interesting day for the market in general!
ES now trading 1251.25 @ 22:55 E.T.
As always, the market has the last word and in due time ill show us the way.
Right now, next hours, next days, next weeks, next months and next years to come, I see for you the same I see for my self: Having the very best of luck, fun, awesome, incredibly profitable trading experience!!
LV from over night 59.00 to 62.25
bruce you reall y donot look at overnight vol after market opens??
first hour gone
air pocket into our key zone....good low ticks...still need to think that the upper edge failed as support.....at 66 - 67...so sellers are active in general...long 61.50...better longs will be below hour lows if they can push it out
we gonna be early to the long party I think...watch hour break down close today
Based on the 73.25-68 move watching for full KT proj of 1259.5
one tick of air still there at 63.50
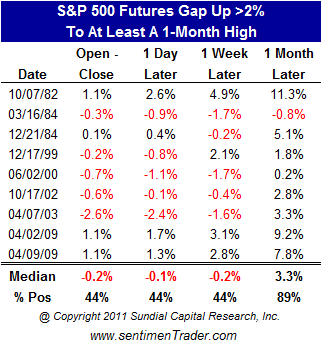
Originally posted by rburns...hope this helps(courtesy of sentimentrader)...btw, fwiw, some time ago i told you to watch for 1068 as an important launch point for a massive year end rally.. i stated that 1270-above 1300 was doable. here we are ,but the wave structure seems like this may be wave 3 of c (1216.50-1273.25) ...if so i would expect a wave 4 pullback here of .382 at least..roughly 1251-2? good trading gang
interesting
10:04 AM Sal Arnuk of Themis Trading notes since January 1, 2000, the S&P has opened 2% higher 254 times. The market has closed lower than the open on 224 of those occasions. [Quick Ideas] Comment!
Click image for original size
and so our battle begins between the 62 and 66 bell curve...very cool...evidence so far seems to pointto higher prices as the 62- 59 basically is holding and failure to extend range beyond the hour lows..us longs would really need to get beyond the 66 - 67 and then see that hold as support on any retest back down.....no doubt a good battle
trying for 71 as last target but i donot have a great market read inside this hour range...failure at this 66 - 67 will go back for 63, 62.25 and then new lows and the 59 and much lower...
peak volume at 66.25...but WTF does that mean right now....?? are they accepting thsese higher prices...? Hope so..a bit clueless as we need more information...runners are getting a workout and so is my patience
peak volume at 66.25...but WTF does that mean right now....?? are they accepting thsese higher prices...? Hope so..a bit clueless as we need more information...runners are getting a workout and so is my patience
Wow, that was a fun day!!! In my last trade, I got my 3 points back and some.
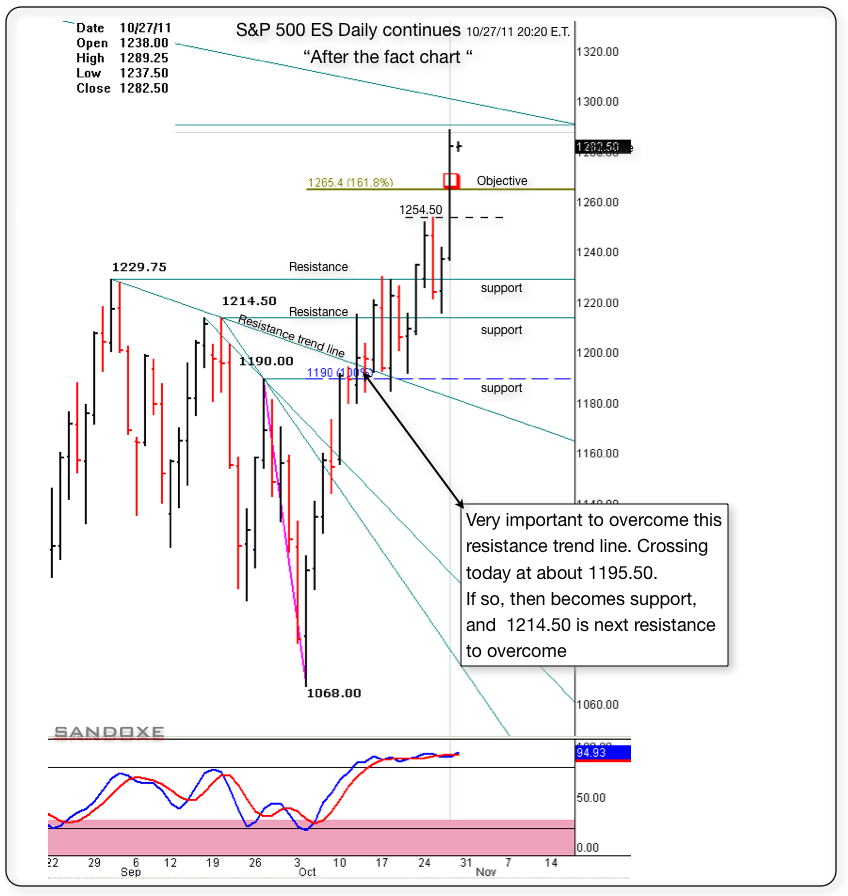
Below is the "After the fact chart" following up the one posted last night.
Below is the "After the fact chart" following up the one posted last night.
Click image for original size
Originally posted by sandoxe
I got stop out, giving 3 points back. It's not going to go up forever.--- It does looks like a capitulation day. WIll see. I will give it an other shot soon.
ES now trading 1287.00 @ 15:30
Originally posted by sandoxe
In your paper trading, if you were looking for shorts, or reversing, this will be a great area to try it out.
Stop above today's high 1282.75,
ES now trading 1279.00 @ 14:11 E.T.
Originally posted by sandoxe
Originally posted by sandoxe
The objective for today is at 1265.00 possible spike to 1279.00 but not necessary .
An interesting day for the market in general!
ES now trading 1251.25 @ 22:55 E.T.
As always, the market has the last word and in due time ill show us the way.
Right now, next hours, next days, next weeks, next months and next years to come, I see for you the same I see for my self: Having the very best of luck, fun, awesome, incredibly profitable trading experience!!
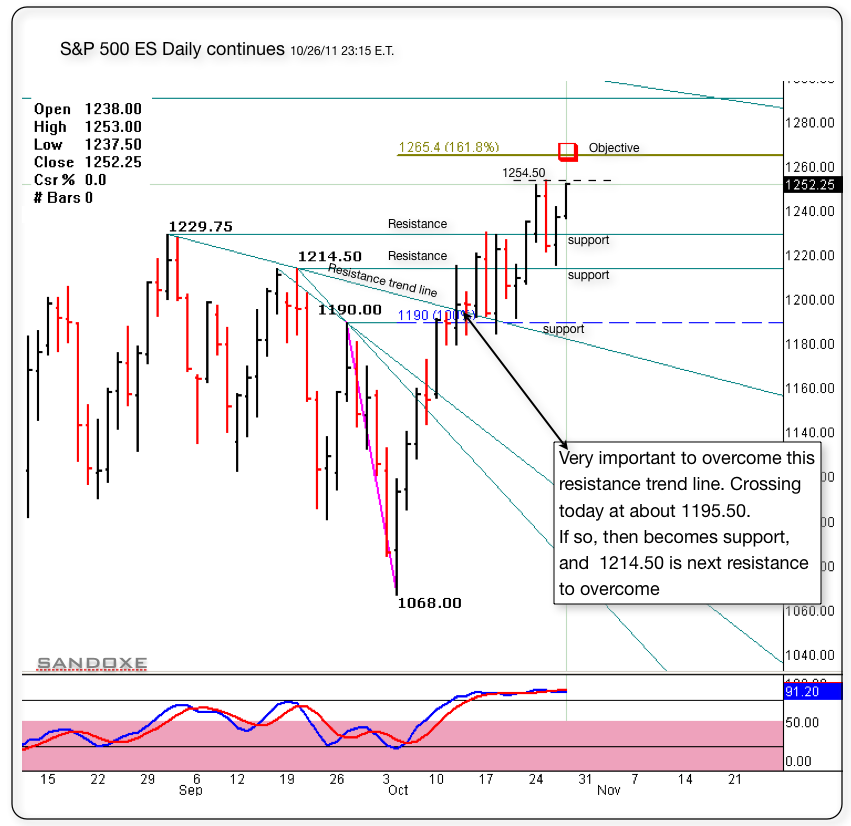
Here's the same daily chart posted back on 10/12. But today, I have the objective at 1.618% 1265.00 due in today's session.
1254.50 is currently a small S/R, overcoming it, will become support.
ES now trading 1252.25 @ 23:43
Click image for original size
Emini Day Trading /
Daily Notes /
Forecast /
Economic Events /
Search /
Terms and Conditions /
Disclaimer /
Books /
Online Books /
Site Map /
Contact /
Privacy Policy /
Links /
About /
Day Trading Forum /
Investment Calculators /
Pivot Point Calculator /
Market Profile Generator /
Fibonacci Calculator /
Mailing List /
Advertise Here /
Articles /
Financial Terms /
Brokers /
Software /
Holidays /
Stock Split Calendar /
Mortgage Calculator /
Donate
Copyright © 2004-2023, MyPivots. All rights reserved.
Copyright © 2004-2023, MyPivots. All rights reserved.