ES Thursday 11-27-2011
The objective for today is at 1265.00 possible spike to 1279.00 but not necessary .
An interesting day for the market in general!
ES now trading 1251.25 @ 22:55 E.T.
As always, the market has the last word and in due time ill show us the way.
Right now, next hours, next days, next weeks, next months and next years to come, I see for you the same I see for my self: Having the very best of luck, fun, awesome, incredibly profitable trading experience!!
Hey sandoxe, can you pop a chart on here showing the analysis ... or at least describe the analysis behind your price levels you're looking at in your post. Would be GREAT and helpful for me and I'm sure for others. Thanks mister!!
MM
MM
Originally posted by sandoxe
The objective for today is at 1265.00 possible spike to 1279.00 but not necessary .
An interesting day for the market in general!
ES now trading 1251.25 @ 22:55 E.T.
As always, the market has the last word and in due time ill show us the way.
Right now, next hours, next days, next weeks, next months and next years to come, I see for you the same I see for my self: Having the very best of luck, fun, awesome, incredibly profitable trading experience!!
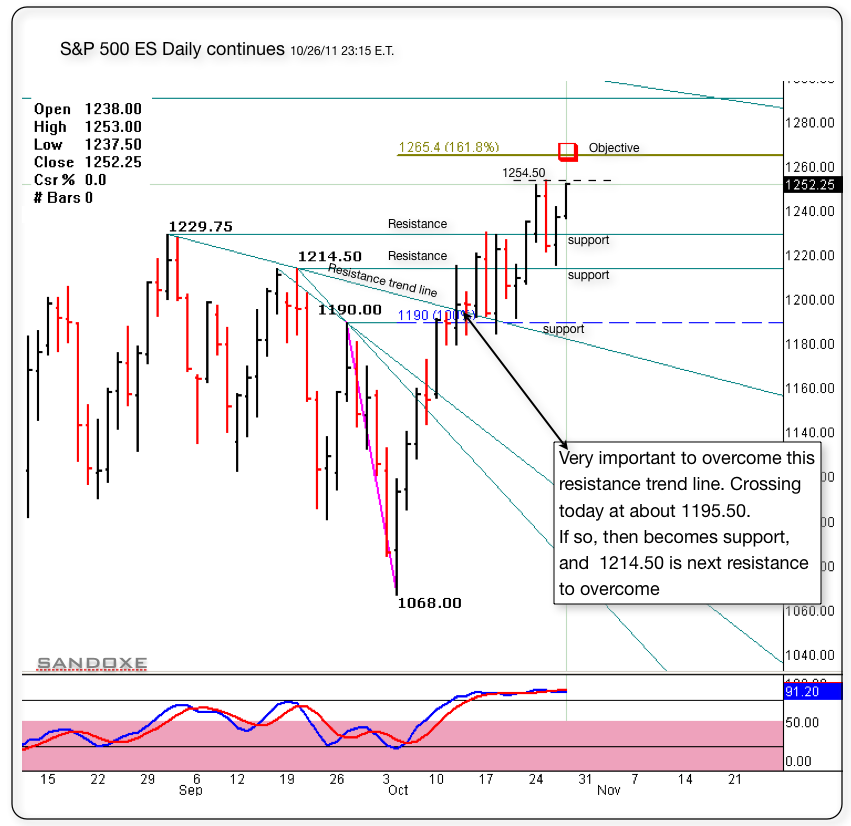
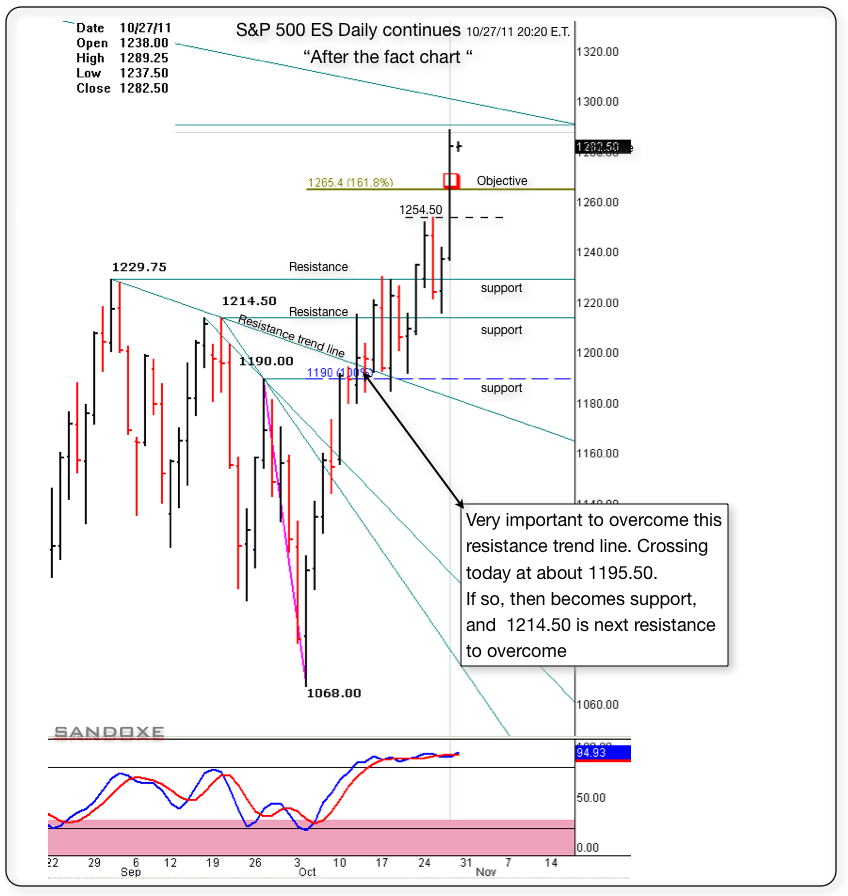
Here's the same daily chart posted back on 10/12. But today, I have the objective at 1.618% 1265.00 due in today's session.
1254.50 is currently a small S/R, overcoming it, will become support.
ES now trading 1252.25 @ 23:43
Click image for original size
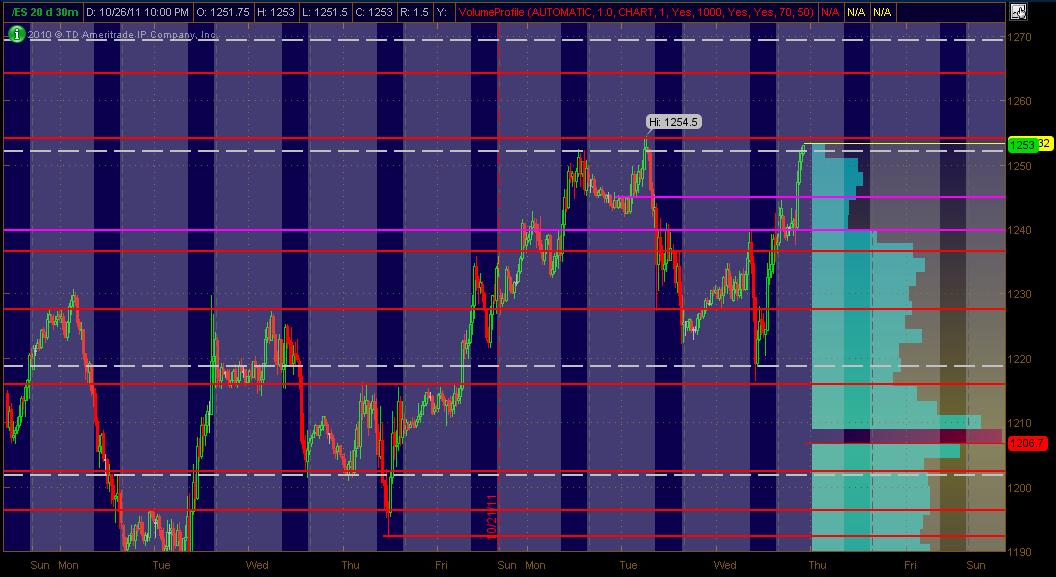
In a 3 minute chart, notice that the ES keeps probing that 1254.50 S/R. Backs off a bit and try it again.
When a resistance is tuff to overcome,but the market is bullish, it will keep trying. It may need to back off to 1250 or so and try it again. Till moves above with momentum, then it may test back as support. -- It's the same story. over and over with S/Rs --- You do have to set a parameter as to where is enough backing off from an S/R, and that only comes with experience.-.
ES now trading 1253.25 @ 01:01
Ok, time for some ZZZZZZZZZZZZZ
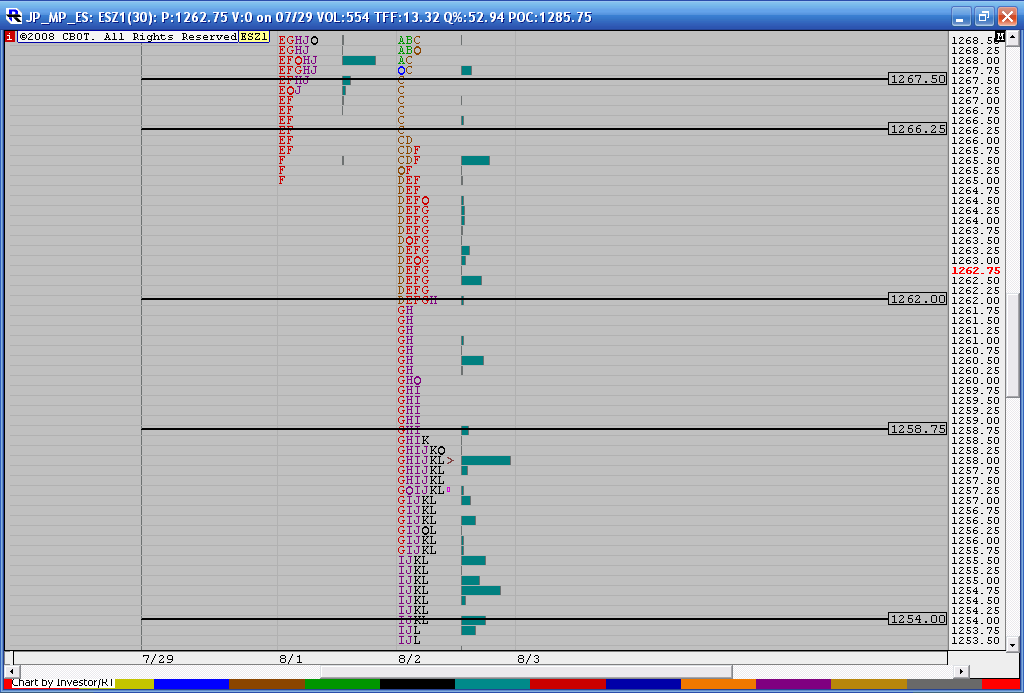
here is the Tpo chart from 8-2-11. We had nice reactions at the 58.75 in the current overnight and now we are hitting up against the key transition point of 62 in the overnight session. We spent 2 1/2 hours consolidating in the 62 - 66 area on that day and then broke down from the 62 to trade lower...no doubt some tight ranges...a critical zone and the big BELL curve (62-66) the buyers need to beat in order to keep going up.
This is a number to sell against and if it wasn't the overnight I would be more agressive into this zone. The next key zone is up at the 66 - 67 area as that would be the upper edge of the bell curve.
We constantly watch to see if we will reject a zone as we enter it from below. If we get to the upper edge then we watch to see if we break out to the upside with weak volume to set up sells for mean reversion back into the consolidation area, This is what the 66 - 67 area represents.
2 1/2 hours should make a strong bell curve..in the day session we would not just blow through this area to the upside unless a news event hits the market....the overnigt is a different animal... I'm real skeptical of any longs above 62 now and we are right at that zone as I type in the overnight now!!
Click image for original size
well the 62 zone was a failure in my opinion......so i am looking for shorts in this 66 - 67 zone...report in 1/2 hour too..good volume in overnight coming in up here...
1267.50 is a single print from 8-2, just to add one more piece to the puzzle.
Next level up if it keeps going is 1274 based on 8/1 or 1277 based on YTD profile.
Click image for original size
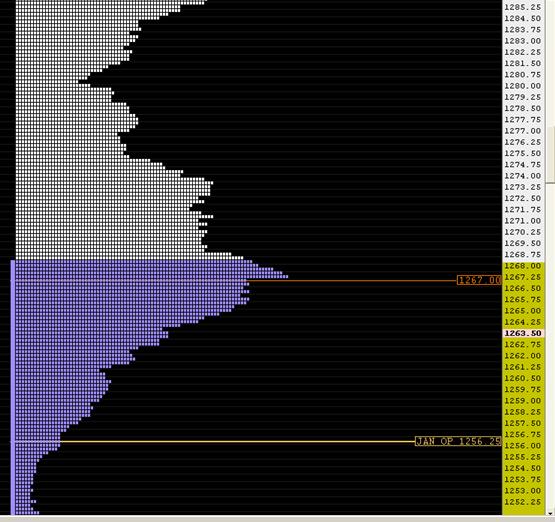
There were essentially 3 up reactions off the Europe news. Using KT, the first move's projection was blown away. The second was a 1237.75-1249 move giving a full projection of 1267.25. The third was a move to 1252 giving a full projection of 1275.0.
On the 67.75 short... a bit early for me and overnight is so much harder because we don't have NYSE open to get our $Ticks to see those great extremes, then air pockets and flips of the footprint into our key zones....so all the pieces aren't there.
Better shorts probably await after 9 a.m or even better...waiting for the day session...so this is much smaller and a bit agressive..targeting 65.25..
Better shorts probably await after 9 a.m or even better...waiting for the day session...so this is much smaller and a bit agressive..targeting 65.25..
Wow, that was a fun day!!! In my last trade, I got my 3 points back and some.
Below is the "After the fact chart" following up the one posted last night.
Below is the "After the fact chart" following up the one posted last night.
Click image for original size
Originally posted by sandoxe
I got stop out, giving 3 points back. It's not going to go up forever.--- It does looks like a capitulation day. WIll see. I will give it an other shot soon.
ES now trading 1287.00 @ 15:30
Originally posted by sandoxe
In your paper trading, if you were looking for shorts, or reversing, this will be a great area to try it out.
Stop above today's high 1282.75,
ES now trading 1279.00 @ 14:11 E.T.
Originally posted by sandoxe
Originally posted by sandoxe
The objective for today is at 1265.00 possible spike to 1279.00 but not necessary .
An interesting day for the market in general!
ES now trading 1251.25 @ 22:55 E.T.
As always, the market has the last word and in due time ill show us the way.
Right now, next hours, next days, next weeks, next months and next years to come, I see for you the same I see for my self: Having the very best of luck, fun, awesome, incredibly profitable trading experience!!
Here's the same daily chart posted back on 10/12. But today, I have the objective at 1.618% 1265.00 due in today's session.
1254.50 is currently a small S/R, overcoming it, will become support.
ES now trading 1252.25 @ 23:43
Click image for original size
Emini Day Trading /
Daily Notes /
Forecast /
Economic Events /
Search /
Terms and Conditions /
Disclaimer /
Books /
Online Books /
Site Map /
Contact /
Privacy Policy /
Links /
About /
Day Trading Forum /
Investment Calculators /
Pivot Point Calculator /
Market Profile Generator /
Fibonacci Calculator /
Mailing List /
Advertise Here /
Articles /
Financial Terms /
Brokers /
Software /
Holidays /
Stock Split Calendar /
Mortgage Calculator /
Donate
Copyright © 2004-2023, MyPivots. All rights reserved.
Copyright © 2004-2023, MyPivots. All rights reserved.