ES Thursday 11-27-2011
The objective for today is at 1265.00 possible spike to 1279.00 but not necessary .
An interesting day for the market in general!
ES now trading 1251.25 @ 22:55 E.T.
As always, the market has the last word and in due time ill show us the way.
Right now, next hours, next days, next weeks, next months and next years to come, I see for you the same I see for my self: Having the very best of luck, fun, awesome, incredibly profitable trading experience!!
short patrol has begun above the 75.....neutral day now..lets see if we get get back to the hour highs
Click image for original size
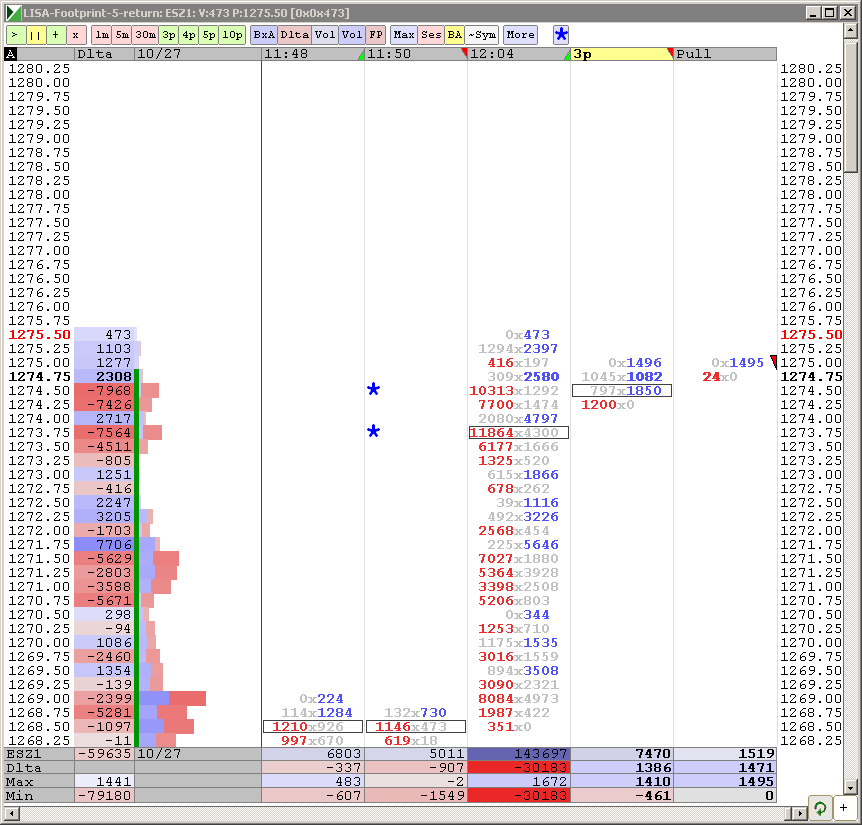
air into the hour high too..c'mon..lets bring it back down......
plus 1400 tick..may require one more push to smooth that out..72.75 is air fill
Originally posted by BruceM
Hey Prestwick...u have a projection of 75 too so how are you specifically trading what seems as two conflicting pieces of information? ThanksOriginally posted by prestwickdrive
Based on the 73.25-68 move watching for full KT proj of 1259.5
I am trading crude oil but I watch the ES because it tends to give good crude oil signals.
Re the seemingly conflicting signals, I have conditioned myself to not look at them that way. The 1275 projection was valid until 1237.75 was taken out and we only retraced to 60.75. Because the market rarely gets to where it wants to go in a line I use KT projections to project up and down cycle inflection points. When down projections miss it tells me the market wants up more. When up projections miss it tells me the market wants down more. After we stopped down at 60.75 I was looking for 1274 based on 60.75-65.75 as well as the outstanding 1275.0. Now that we have topped 75.0 I am watching for 60.75-68.25 givnig a full projection of 1280.5 until 60.75 is taken out.
With this drop from 75.75 now working I will watch for where the initial move stops to get initial and full down projections. The initial "should" be a good long point, especially if it coincides with a key volume level like you point out (initial projections against a trend tend to work well for a counter trade). Meanwhile the 80.5 is likely to be in play for a possible target from that long. If that level gets blown through I will watch for the full projection and if that gets taken out something else is going on.
I also use volume profile, single prints and IB extensions, fwiw.
I hope this makes some sense. I used to think it was hocus pocus when KB first introduced it but the more I use it with the other tools the better my trading has gone. When I abandon the price target discipline I usually get crushed.
Good explanation PW. You show there is more then one way to trade. The key is a set of disciplines for following whatever a trader chooses to follow and use.
thanks Prestwick...no hocus pocus..Kool has proved it many times...I appreciate your response
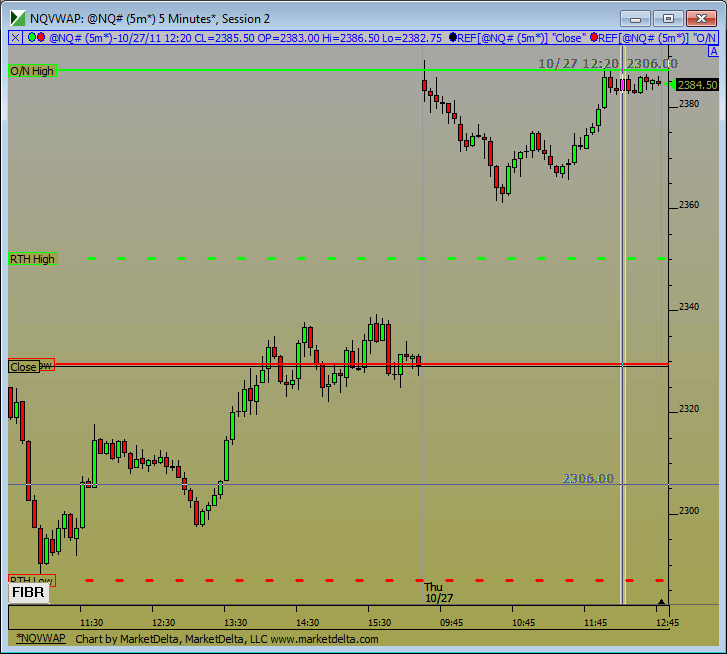
Single sitting at 1272.75 currently. Up volume has dried up for the moment and NQ can't seem to get through its own O/N high.
Speaking of other methods...for those O'Neil acolytes, NQ has a classic cup with handle formation right now....LOL!
Here is the chart. I'd look for clues with this for afternoon trade. If NQ can't get over that O/N high ES should have difficulty maintaining upside momentum.
Here is the chart. I'd look for clues with this for afternoon trade. If NQ can't get over that O/N high ES should have difficulty maintaining upside momentum.
Click image for original size
Thanks Lorn and Bruce, especially for all of your and other's contributions here which have infinitely increased my knowledge.
Re that move off of 75.75, we got to 72.75. That gives an initial of 71.0 that should bring at least a tradable buy scalp unless the rally for the day is spent. If we go throgh that the full projection is 68.0 which again should be a good place to poke long. If those fail it would tell me that we may have run out of upward steam for a while.
No guarantees - just probabilities.
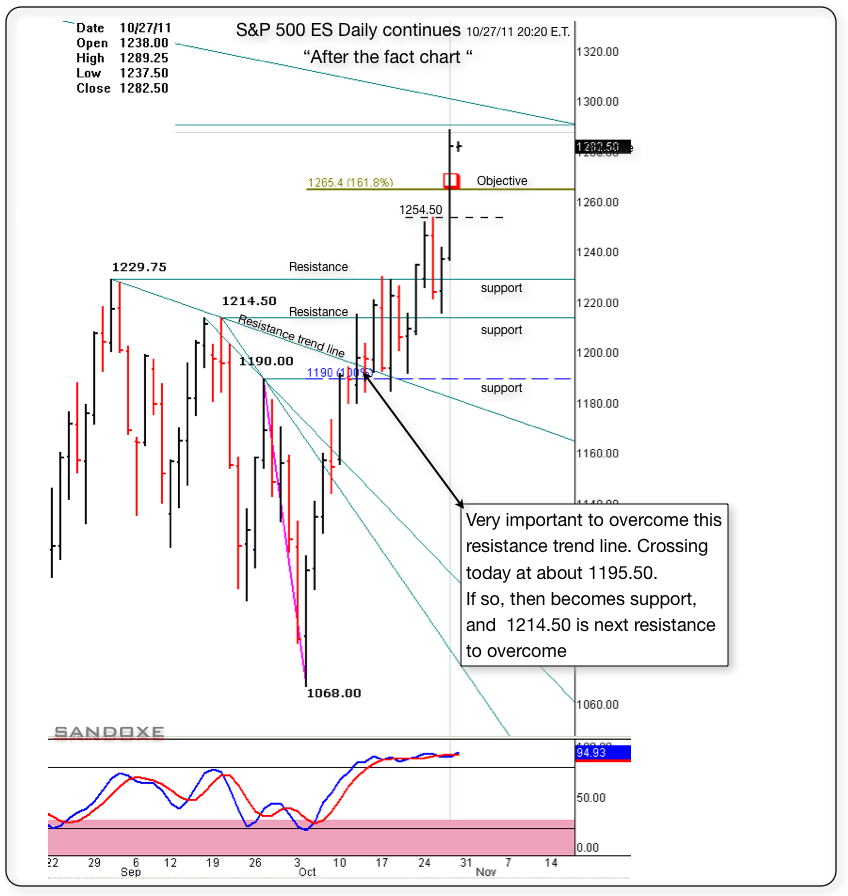
Wow, that was a fun day!!! In my last trade, I got my 3 points back and some.
Below is the "After the fact chart" following up the one posted last night.
Below is the "After the fact chart" following up the one posted last night.
Click image for original size
Originally posted by sandoxe
I got stop out, giving 3 points back. It's not going to go up forever.--- It does looks like a capitulation day. WIll see. I will give it an other shot soon.
ES now trading 1287.00 @ 15:30
Originally posted by sandoxe
In your paper trading, if you were looking for shorts, or reversing, this will be a great area to try it out.
Stop above today's high 1282.75,
ES now trading 1279.00 @ 14:11 E.T.
Originally posted by sandoxe
Originally posted by sandoxe
The objective for today is at 1265.00 possible spike to 1279.00 but not necessary .
An interesting day for the market in general!
ES now trading 1251.25 @ 22:55 E.T.
As always, the market has the last word and in due time ill show us the way.
Right now, next hours, next days, next weeks, next months and next years to come, I see for you the same I see for my self: Having the very best of luck, fun, awesome, incredibly profitable trading experience!!
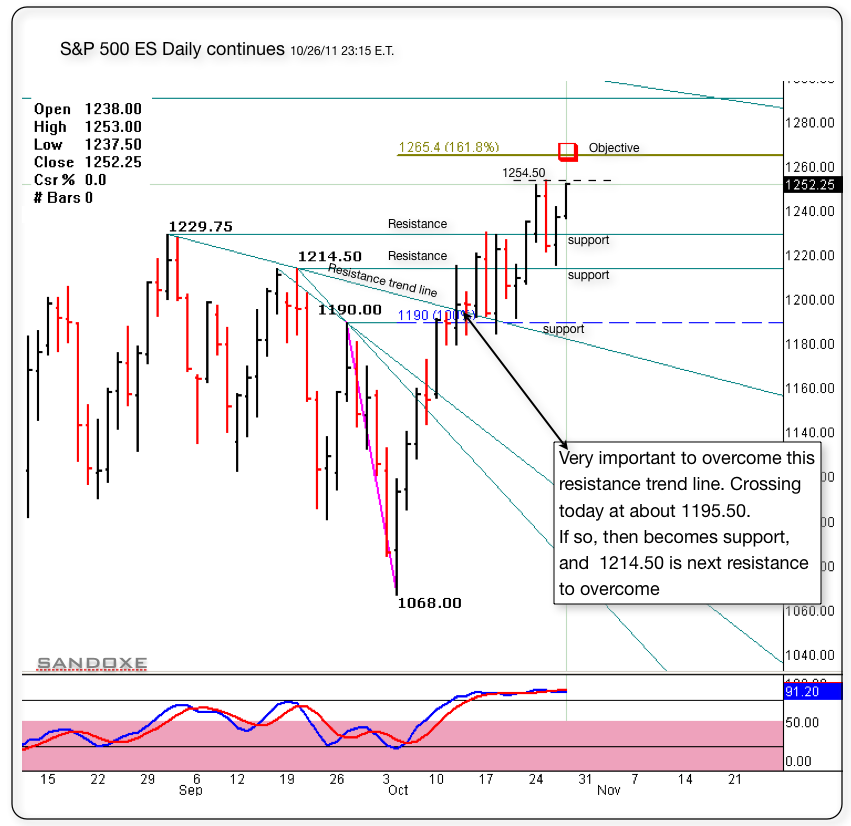
Here's the same daily chart posted back on 10/12. But today, I have the objective at 1.618% 1265.00 due in today's session.
1254.50 is currently a small S/R, overcoming it, will become support.
ES now trading 1252.25 @ 23:43
Click image for original size
Emini Day Trading /
Daily Notes /
Forecast /
Economic Events /
Search /
Terms and Conditions /
Disclaimer /
Books /
Online Books /
Site Map /
Contact /
Privacy Policy /
Links /
About /
Day Trading Forum /
Investment Calculators /
Pivot Point Calculator /
Market Profile Generator /
Fibonacci Calculator /
Mailing List /
Advertise Here /
Articles /
Financial Terms /
Brokers /
Software /
Holidays /
Stock Split Calendar /
Mortgage Calculator /
Donate
Copyright © 2004-2023, MyPivots. All rights reserved.
Copyright © 2004-2023, MyPivots. All rights reserved.