ES Thursday 1-5-12
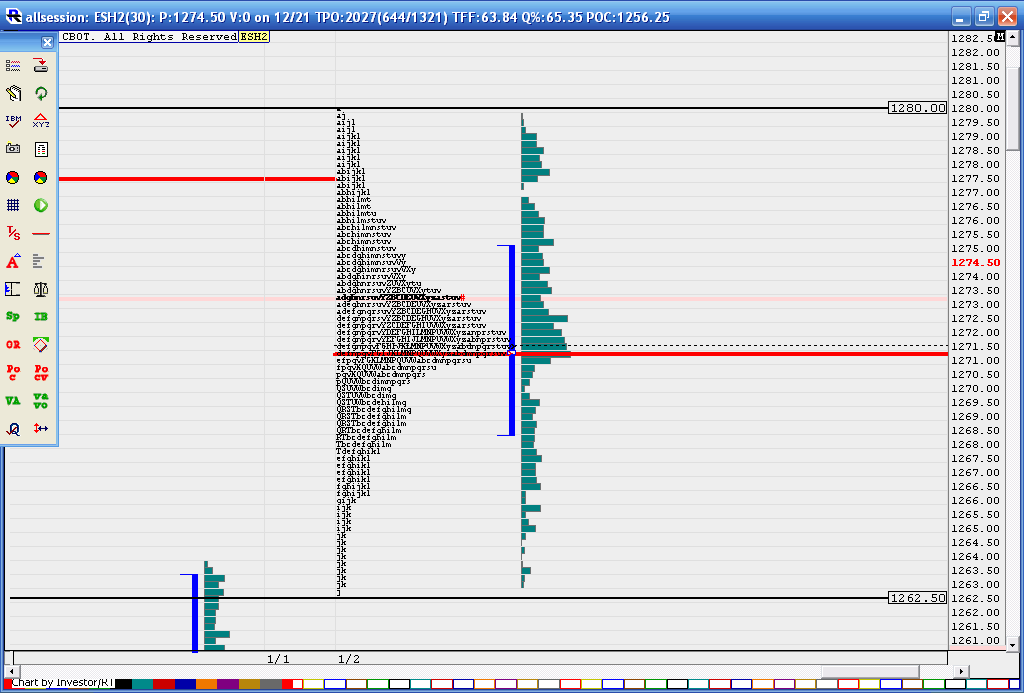
A quick look at the nice balance we have heading into Thursdays trade. This is a view of all session data for this current week. Note the nice balance and peak volume at the 1271 area and then the market has extremes about 9 points away on the upside at 1280 and also 9 points to the downside at 1262. Lets see what the 8:30 reports bring our way.
Click image for original size
flat at 63.25...no runners
the original pitbull thread...needs some minor updating but still valid...
http://www.mypivots.com/board/topic/1337/1/pitbull-three-strategy
http://www.mypivots.com/board/topic/1337/1/pitbull-three-strategy
Hey Bruce,
You mentioned that you incorporate "order flow" in you pitbull trading. Could you give a little more info on "order flow" and how you define/assess it?
Thanks!
You mentioned that you incorporate "order flow" in you pitbull trading. Could you give a little more info on "order flow" and how you define/assess it?
Thanks!
if we can get the hour close inside the overnigt range and YD range then we have a shot at going back to the 70 - 73 area mentioned earlier...this would imply a failed breakout from the balance on page one
of course I am flat and not long but will look to get long....I hope..ha!!
of course I am flat and not long but will look to get long....I hope..ha!!
the footprint chart is what I use but i am also using the pure volume and the range of bars......sort of like a VSA trader would do....footprints are still on my other machine for trades
Originally posted by Sangeo
Hey Bruce,
You mentioned that you incorporate "order flow" in you pitbull trading. Could you give a little more info on "order flow" and how you define/assess it?
Thanks!
beautifull test of the OR low ( one minute low)....that would have been my pitbull mentors ultimate target on the very rare days he held runners
Great information Bruce, Thank you very much
no problem Chris...most will ignore the pitbull numbers as it is just too easy and not sophisticated for most...as traders we like to think that the more complex something is then the greater the effectiveness......so the pitbull numbers get dismissed as "silly" or ridiculous......I had the same reaction when they were originally explained to me......
here is a first try at explaining this concept about the 30, 60 and 90 minute bar breaks as requested by AYN yesterday....
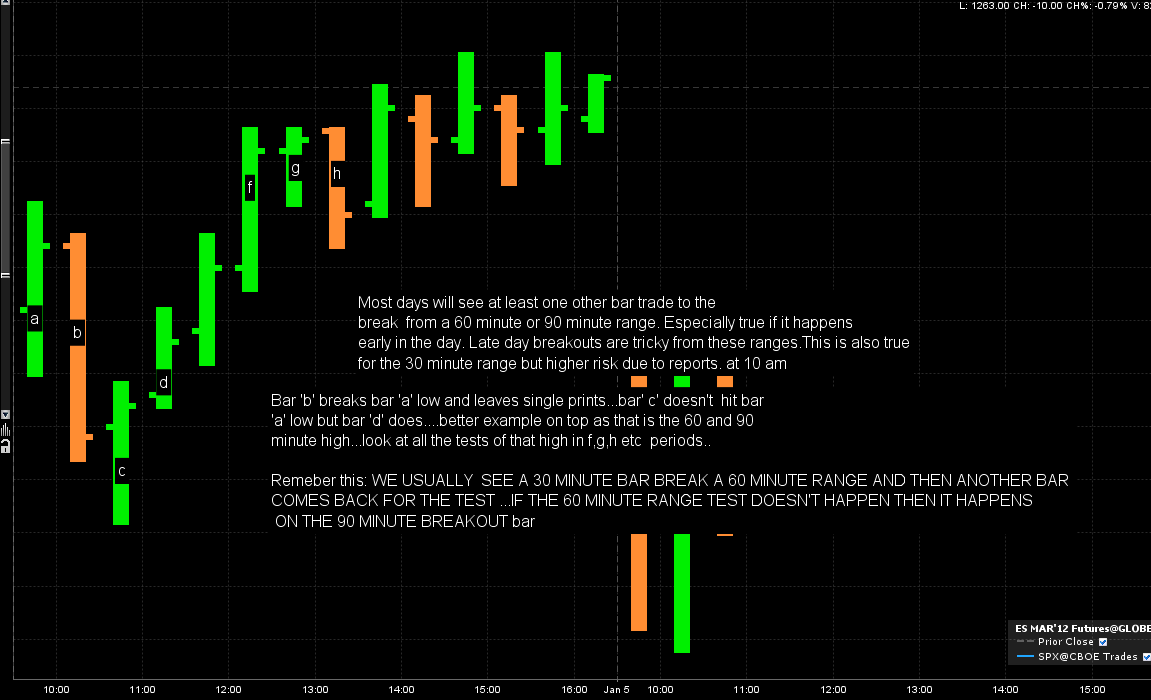
the basic concept is that you donot usually see just one thirty minute bar trade through a break from a 60 or 90 minute range,,,,often there will be an additional 30 minute bar ( tpo) that tests those ranges besides the breakout bar.
Most have sharp minds here on the forum so incorporate the concept of single prints and the fact that we usally donot have TWO sets of single prints trade on a given day without at least one filling in.
On this chart here we had single prints on the break out down from bar "a" .so when bar "c" broke below bar "b"'s lows they were starting on the second set of singles...this happened into a key support number...so we had a good probability of turning back up and using that bar 'a' low as an initial target...
hoping to get a better example today and give me feedback as I am making this too complicated and it really isn't. This doesn't address specific entires and it is just a concept to use for fades especially when the early morning trades fail. This makes sense because if we trend in the morning then they need time to pause.
We can create probabilities: for example if we see a single print form on a 60 minute breakout and then ask what the probability is that we will also breakout from the 90 minute without coming back to test the 90 minute....etc, etc...
We can also get probabilities if the 30, 60, 90 minute ranges all share the same high and/or low.....this is consolidation....so will breakouts return undr those conditions....how about the average range of the day or IB....?lots of cool things
Click image for original size
as per my comments above in my last post today we have a 60 and 90 minute range that is the same...so will a break from the high or the low in one 30 minute period have an additional 30 minute bar come back to test the breakout?
thanks bruce have great night
Emini Day Trading /
Daily Notes /
Forecast /
Economic Events /
Search /
Terms and Conditions /
Disclaimer /
Books /
Online Books /
Site Map /
Contact /
Privacy Policy /
Links /
About /
Day Trading Forum /
Investment Calculators /
Pivot Point Calculator /
Market Profile Generator /
Fibonacci Calculator /
Mailing List /
Advertise Here /
Articles /
Financial Terms /
Brokers /
Software /
Holidays /
Stock Split Calendar /
Mortgage Calculator /
Donate
Copyright © 2004-2023, MyPivots. All rights reserved.
Copyright © 2004-2023, MyPivots. All rights reserved.