ES Thursday 9-29-16
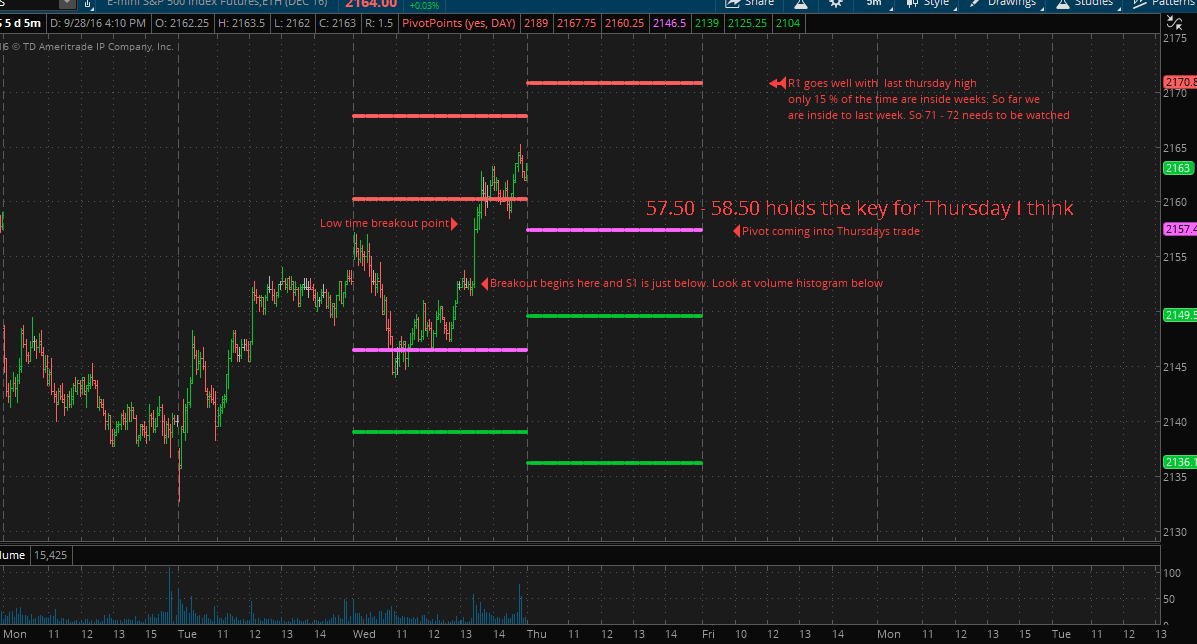
Messing with my TOS charts tonight...here is the basics of how I see it....as usual I will revise and check MP charts with overnight action in the morning
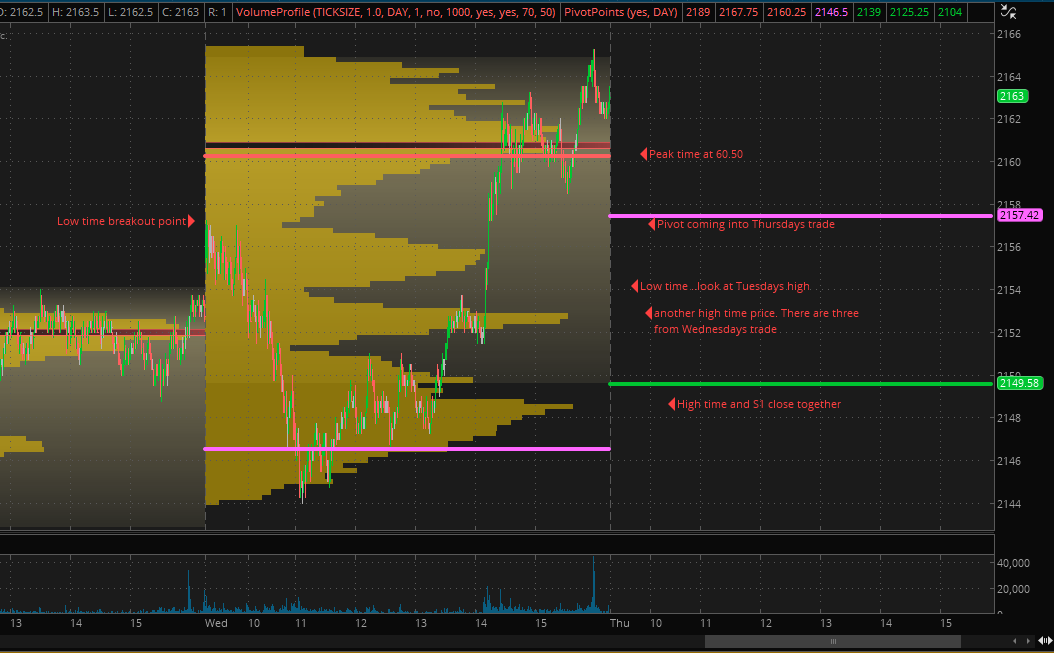
I think it's best to use the areas that have the most confluence...to me that is the 57.50 - 58.5, the 53 - 54 and the 48.50 - 49.50...here is another view..with the time histogram on the one minute included
Click image for original size
I think it's best to use the areas that have the most confluence...to me that is the 57.50 - 58.5, the 53 - 54 and the 48.50 - 49.50...here is another view..with the time histogram on the one minute included
Click image for original size
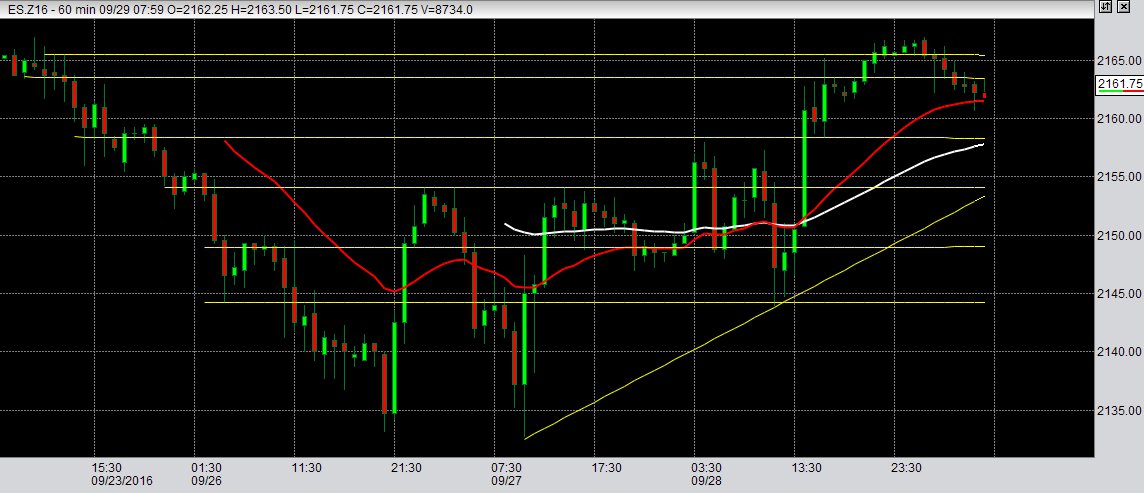
here is my 60 min chart with lines i got..there is gap in data at 46.75 and 50.75 best see on 5 min chart or 1 min chart..i think today we will see those gap fill in the morning.
Click image for original size
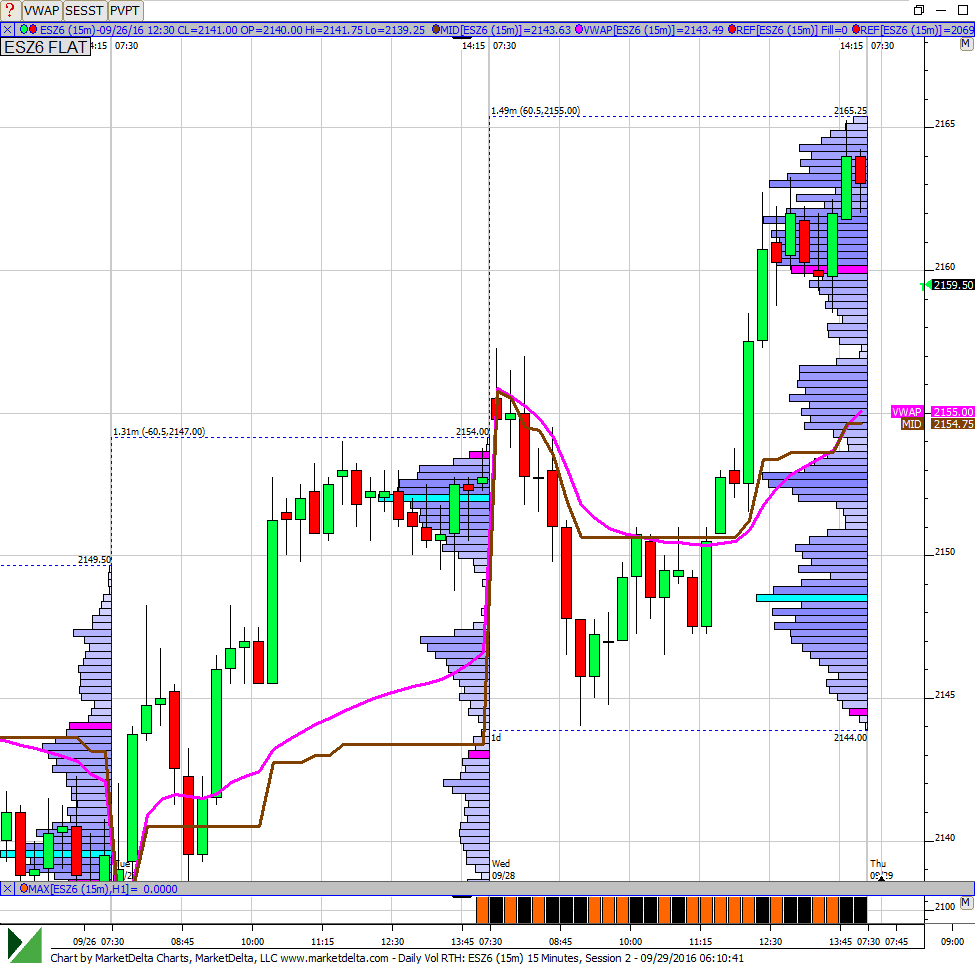
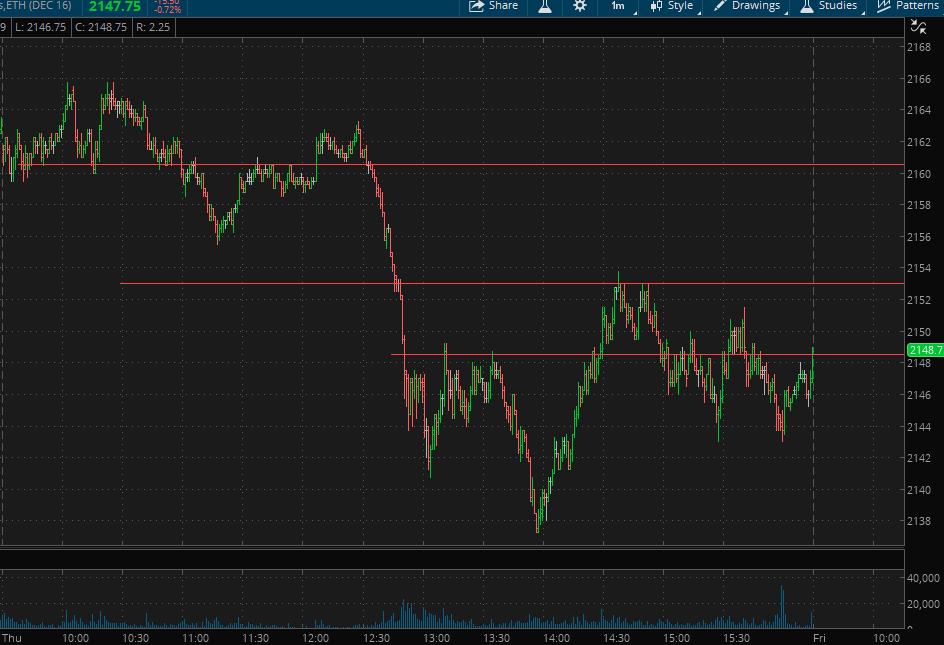
First chart is a 15-min chart showing the volume profile. Lines up pretty closely with Bruce's 1-min time profile charts. 57.25 is the key LVN from YD. Then there is confluence around YD's mid (54.75) and VWAP(55) alongwith there being another LVN at 54.
Second chart is the 5-min chart with developing VPOC. We can see that there was a VPOC at 55.5 earlier in the day but that shifted down to 48.5 and stayed there for the remainder of the day even though prices rallied. This can also be seen in the first chart as the cyan bar on the volume profile chart.
Click image for original size
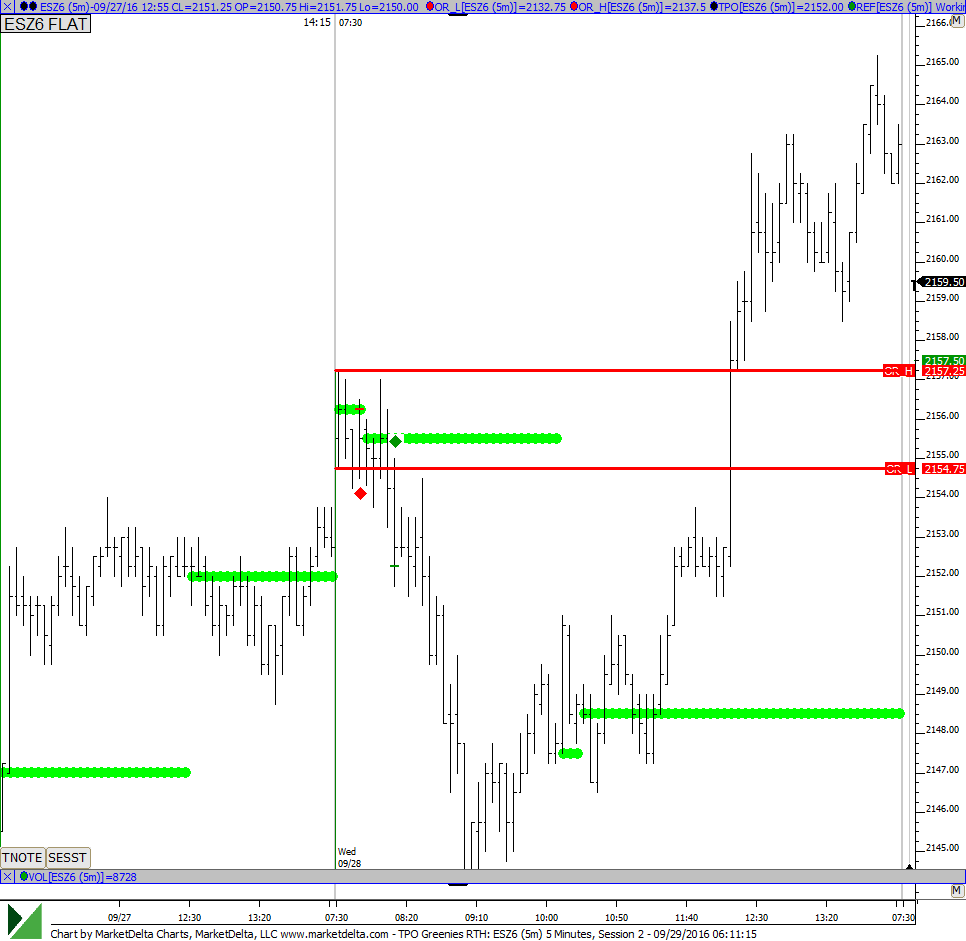
also note how YD once prices broke into the OR (between the 2 red lines), it triggered a boat load of stops and prices just took off blowing through a greenie at 58.5 Prices came back to test that level and it became support at that point.
most of this has been covered so the only thing that may be different is the discussion of the gap at 66.50 and weekly pivot confluence so this will become old to those who have been around but may be helpful to those who are new ...great to see all the charts and postings...I plan to try for the O/N midpoint still and realize if I am wrong then the 54 area is the place they will try to bring it....that 60.50 is getting my way...LOL
hey bruce was that your 300 lot buy at 59.75? lol. i dont trust big lots in the 1 st 30min rth..
flat at midpoint...that's it for me as a daytrader...c ya tomorrow
actually gonna stick around and for gap at 59 now..so shorting
selling new highs in rth keeping this small as do not want to turn into a loser on the day.....
taking something at 60.75....center of bell is 60.50 so don't trust that,,,holding two runners
Almost all time so far has been spent inside the 5-min OR
ONL, PP and LVN at 57.5
0.5 SD band at 56.5
ONL, PP and LVN at 57.5
0.5 SD band at 56.5
I thought this was interesting as usual - it drives home the concept of how often high time prices get retested when the market just passes through them as if they aren't there......so for those that trade more often you can look for trades AT the high time areas but if you don't get signals and volume clues then you can look at other areas and use the high time areas as Targets...so the moral of the story is this - Most times high time areas that get blown through sees price come back to retest those areas...
here is todays EOD chart with only the 3 high time areas I mention last night on the chart.....
here is todays EOD chart with only the 3 high time areas I mention last night on the chart.....
Click image for original size
Emini Day Trading /
Daily Notes /
Forecast /
Economic Events /
Search /
Terms and Conditions /
Disclaimer /
Books /
Online Books /
Site Map /
Contact /
Privacy Policy /
Links /
About /
Day Trading Forum /
Investment Calculators /
Pivot Point Calculator /
Market Profile Generator /
Fibonacci Calculator /
Mailing List /
Advertise Here /
Articles /
Financial Terms /
Brokers /
Software /
Holidays /
Stock Split Calendar /
Mortgage Calculator /
Donate
Copyright © 2004-2023, MyPivots. All rights reserved.
Copyright © 2004-2023, MyPivots. All rights reserved.