ES 12-11-2008
- Page(s):
- 1
- 2
- 3
- 4
- 5
- 6
- 7
- 8
- 9
- 10
- 11
- 12
- 13
- 14
- 15
- 16
- 17
- 18
- 19
- 20
- 21
- 22
- 23
- 24
- 25
- 26
- 27
- 28
- 29
- 30
- 31
- 32
- 33
- 34
- 35
- 36
- 37
- 38
- 39
- 40
- 41
- 42
- 43
- 44
- 45
- 46
- 47
- 48
- 49
- 50
quote:
Originally posted by pt_emini
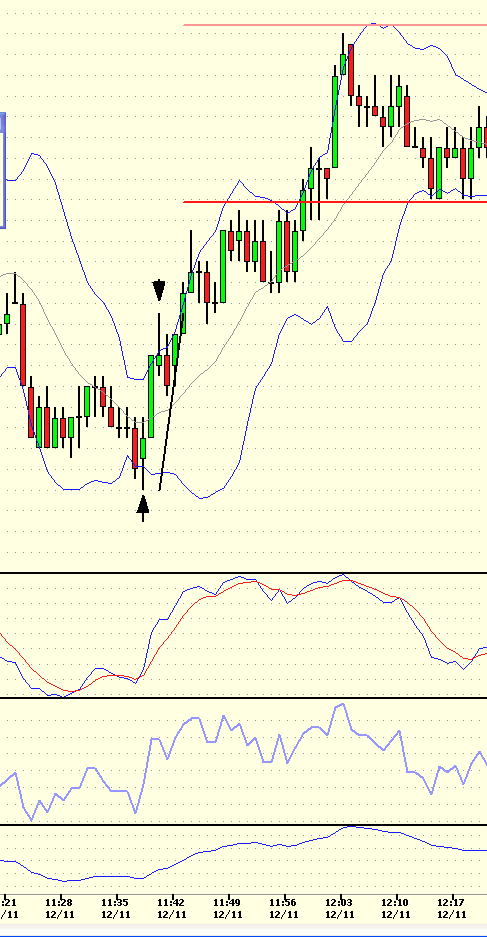
feng - look at the chart I just posted. No oscillators, no moving averages, no color, no candlesticks. If price breaks that blue line at 876.50 our projection is up to 884 then 892 above that. This ABC trade setup is as simple as that. I would also note it is forming an inverse head and shoulders pattern.
For MP purists, the singles are at 884.25. Singles are a natural resistance level MP traders will fade on first touch. Above that resistance price, we are looking at an 80% rule buy signal for a 906 target.
ok so how do i draw these lines?
quote:
Originally posted by myptofvu
Feng,
Heres a snapshot showing a price projection on a 1 min chart, the 1st line is the 1.618 the 2nd is the 2.618. I'm looking for the distance moved b4 a retracement then measure that to get the projections.
I find it's important to find the beginning of the move to take your measurements from.
Also this is a pretty clear example but they're not all that easy to see, on the more difficult ones it helps me to imagine what it might look like on a 30 second or 15 second time chart to take my measurements.
With some practice I think you will easily see how to do this and that Koolblue has really come up with something good here.
Click image for original size
oh i agree he's got a good system. i just lack the understanding to use it properly.
so what are all those lines and how do i draw them?
quote:
Originally posted by wsjalerts13
Kool, VO, Pt, Mypt and others -
How do we project when the trend will change direction ? Do we take the latest swing high and low and plot the numbers against them or/and look at will%r, bb, stoch for overbought/oversold ??
Thanks.
I think thats where Kools time cycles come into play but to be honest I havent learned that well enough yet when I try to do it I'm wrong way more times than I'm right.
I don't try to look for the trend to necessarily change direction but to take based on where we will have a bounce.
One thing I do do (oooh I said dodo) is to use both the 1.618 and 2.618 projections and if the move only goes to the 1.618 instead of the 2.618 then that means to me that that is the direction the market is currently in.
what periods shud i use for bollinger bands?
Feng do you have Skype? it would be easier to talk to you...
quote:
Originally posted by myptofvu
Feng do you have Skype? it would be easier to talk to you...
i had skype then i uninstalled cuz it had lousy connections. but i think my account may be still active. whats ur username or whatever?
quote:
Originally posted by feng456
quote:
Originally posted by myptofvu
Feng do you have Skype? it would be easier to talk to you...
i had skype then i uninstalled cuz it had lousy connections. but i think my account may be still active. whats ur username or whatever?
skype Id is rthtrader
Emini Day Trading /
Daily Notes /
Forecast /
Economic Events /
Search /
Terms and Conditions /
Disclaimer /
Books /
Online Books /
Site Map /
Contact /
Privacy Policy /
Links /
About /
Day Trading Forum /
Investment Calculators /
Pivot Point Calculator /
Market Profile Generator /
Fibonacci Calculator /
Mailing List /
Advertise Here /
Articles /
Financial Terms /
Brokers /
Software /
Holidays /
Stock Split Calendar /
Mortgage Calculator /
Donate
Copyright © 2004-2023, MyPivots. All rights reserved.
Copyright © 2004-2023, MyPivots. All rights reserved.