Here are the key numbers from Fridays trade and a chart with the volume showing why they are key. On your own charts you can compare where your high volume is with price.
1300
1295
1288 - 1289
Click image for original size
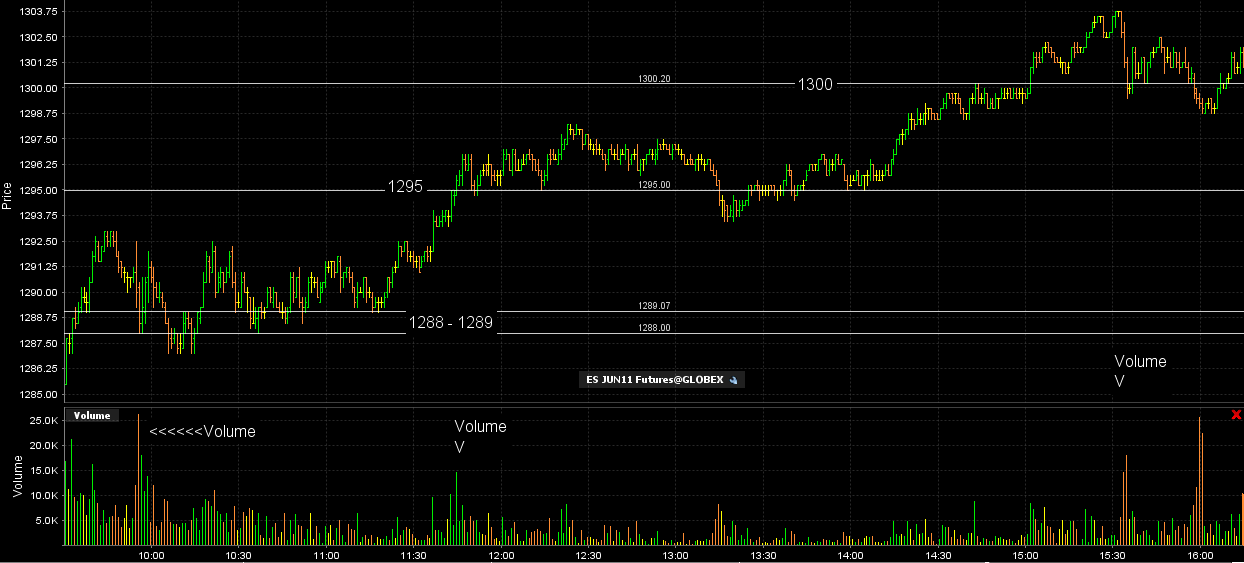
The upper zone not shown on the chart is up near 1308 just in case we rally in the ON session on Sunday