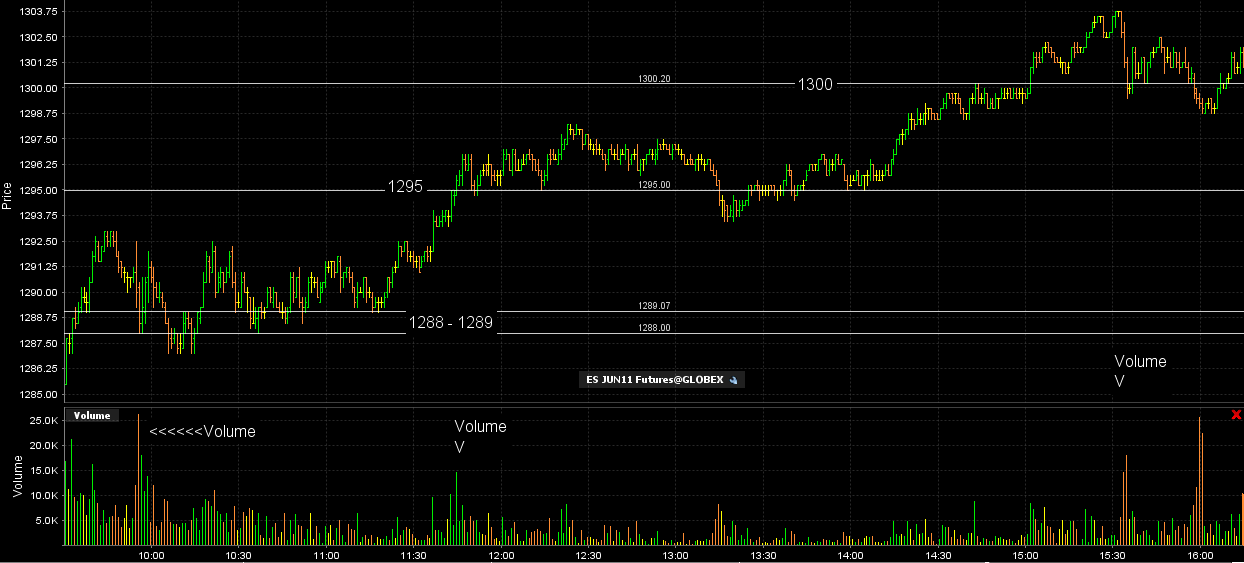
Here are the key numbers from Fridays trade and a chart with the volume showing why they are key. On your own charts you can compare where your high volume is with price.
1300
1295
1288 - 1289
The upper zone not shown on the chart is up near 1308 just in case we rally in the ON session on Sunday
BR
BruceM
Rep: 216,211
Posts: 19,895
I will not be fading the 95 IF we come back up to it now because todays volume bar is also on the low near the other volume of 88 - 89...that implies buyers to me so that would increase the odds for 1300 to print
trade back to 93.50 will stop cuurent short out....trying to get new rth lows
KO
koolblue
Rep: 48,651
Posts: 16,032
BINGO on my expected buy zone 1290.50-1291.00... now can they muster a rally?...
PT
pt_emini
Rep: 5,707
Posts: 1,940
60 minute candle closing weak... waiting for to IB close and then see if the market can break the IB Low with a nice volume surge !
KO
koolblue
Rep: 48,651
Posts: 16,032
Originally posted by koolblueBruce, see those 5 min triples at 1298.75? from around 6:00 this morning? I bet the market does too!
BINGO on my expected buy zone 1290.50-1291.00... now can they muster a rally?...
KO
koolblue
Rep: 48,651
Posts: 16,032
one more try! stopped at 1289.00, 5 handles down total!.. re buy around 1287.25
PT
pt_emini
Rep: 5,707
Posts: 1,940
Originally posted by koolblue
Long from 1287.25...
Nicely done, they tested 87.00 three times and it held !