ES Key numbers for 3-14-11
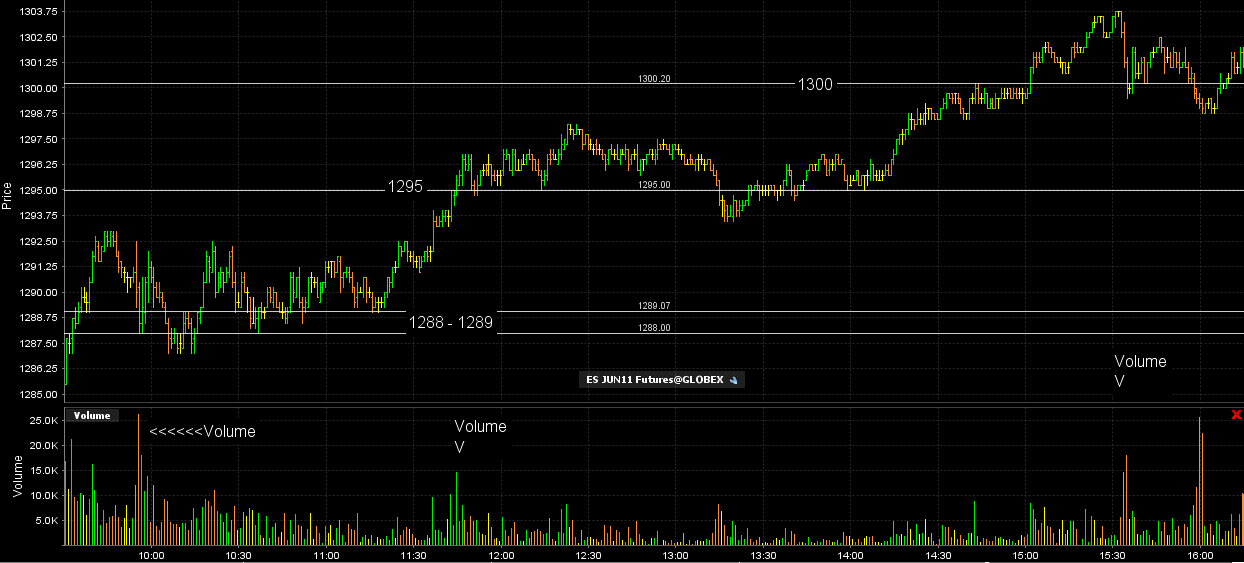
Here are the key numbers from Fridays trade and a chart with the volume showing why they are key. On your own charts you can compare where your high volume is with price.
1300
1295
1288 - 1289
The upper zone not shown on the chart is up near 1308 just in case we rally in the O/N session on Sunday
1300
1295
1288 - 1289
Click image for original size
The upper zone not shown on the chart is up near 1308 just in case we rally in the O/N session on Sunday
one last thing for those who may play in the O/N session..I have a volume area in the 81 - 82.50 from the early morning premarket on Friday.....
According to the CME website the 1289 had the most volume associated with it on Friday....followed by the 1300 area and then the least volume was at 1295..based on the 3 key areas I posted only....this you can see on my chart but the idea I'm throwing out is to watch and see which number has the most power ...meaning which acts best as Support or resistence and which doesn't......in general you will find that the ones with most volume will be the best and those with less volume get blown through easier.......this makes sense but I'm presenting it as a way to filter better zones based on relative volume to each zone...
Man, does that babble makes sense.....?
"I picked a bad week to quite sniffing clue" - Airplane
Man, does that babble makes sense.....?
"I picked a bad week to quite sniffing clue" - Airplane
So Bruce on that chart are you using the high of the one minute bar if its an up bar and the low of the one minute bar if its a down bar?
Tossing in my 2 cents of a MAP for Monday's trading. The Red lines are potentially significant PASR with Magenta lines semi-significant. The Whitish dashed lines are simply the Weekly Pivot prices. The Gray areas are "overnight" sessions with Blue background as RTH. The Volume Profile of this ES June contract (so far) is on the right vertical axis. Again, this is just a map for potential S/R ZONES. Hope some find it helpful. (Btw, drew all these lines in on Saturday morning)
Click image for original size
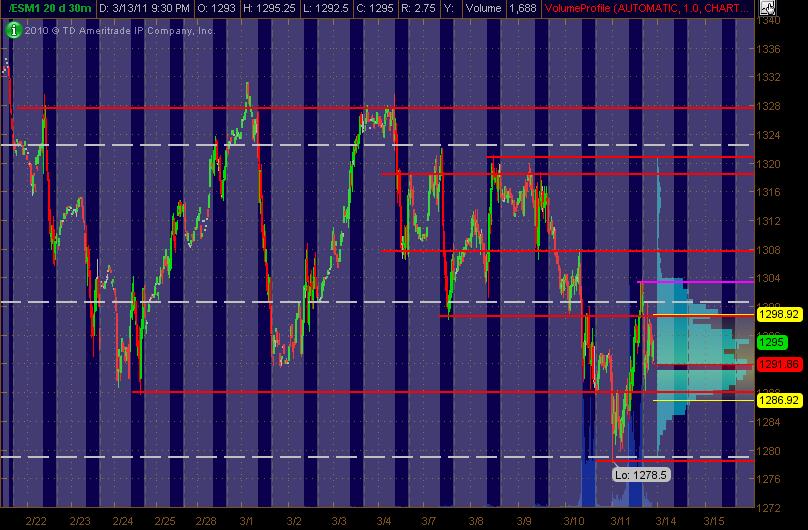
To put numbers to it:
1278
1288
1298-1300
(1304)
1308
These are the primary #'s I've got ... weird how I'm seeing 10 point steps at the "08's" ... with minor at 1304. No fib work ... will leave that to others if desired.
MM
1278
1288
1298-1300
(1304)
1308
These are the primary #'s I've got ... weird how I'm seeing 10 point steps at the "08's" ... with minor at 1304. No fib work ... will leave that to others if desired.
MM
Not specifically Lorn to generate the areas but I will look for "Common" areas to pass through....for example look at the 9:33 bar and then the 9:55 bar...they both have volume spikes into the 1288 - 89 area so that becomes the area....then look at the 11:44 bar and the retest at 13:14...they both pass through 95 and have volume spikes that confirms that area.....
One could also use a 10 minute Volume profile chart and find common numbers that show volume buldges......the thing you don't want is to have too many numbers unless you are a trading machine....find the common areas that buldge...for me it's just easier to see the volume on the vertical scale
Some ideas I'm messing with after market hours is to use an opening range as a filter and then use the volume nodes as targets off the range...
For example: Suppose we open at around 1295 in todays session and get a break out of the 5 minute high ( Joe's mini I.B)...then is it feasable to target the 1300 Volume number ? Or if we break the low then can we target the 1289 area...of volume....How often would we need to stop and reverse ? Suppose we break the 5 minute low but stop short of the 1289 number , then can we take the break of the 5 minute high for better odds of a move up...?That's just one idea I think about in order to make the trade for tests of volume more systematic for the average trader.
There is no question that the tests will come but will we be on board to get them?
For today I prefer to buy somewhere under 91 as close to the 89 zone as possible with the 95 retest in mind///
Originally posted by Lorn
So Bruce on that chart are you using the high of the one minute bar if its an up bar and the low of the one minute bar if its a down bar?
Long in O/N at 91.75...looking for 95 retest....I'm probably early and the RTH longs will be better down near the 89 area,,,,as that is a key area but also a point where VA low buyers will have their stops and get run out

Sold short 1294.00 on the test of the 1294.50 low volume level.
Originally posted by pt_emini
Sold short 1294.00 on the test of the 1294.50 low volume level.
Covered at 91.00 even... will look at a re-entry at the VWAP 1293.25
at least thats what seasonals hint at
Emini Day Trading /
Daily Notes /
Forecast /
Economic Events /
Search /
Terms and Conditions /
Disclaimer /
Books /
Online Books /
Site Map /
Contact /
Privacy Policy /
Links /
About /
Day Trading Forum /
Investment Calculators /
Pivot Point Calculator /
Market Profile Generator /
Fibonacci Calculator /
Mailing List /
Advertise Here /
Articles /
Financial Terms /
Brokers /
Software /
Holidays /
Stock Split Calendar /
Mortgage Calculator /
Donate
Copyright © 2004-2023, MyPivots. All rights reserved.
Copyright © 2004-2023, MyPivots. All rights reserved.