ES Key numbers for 3-14-11
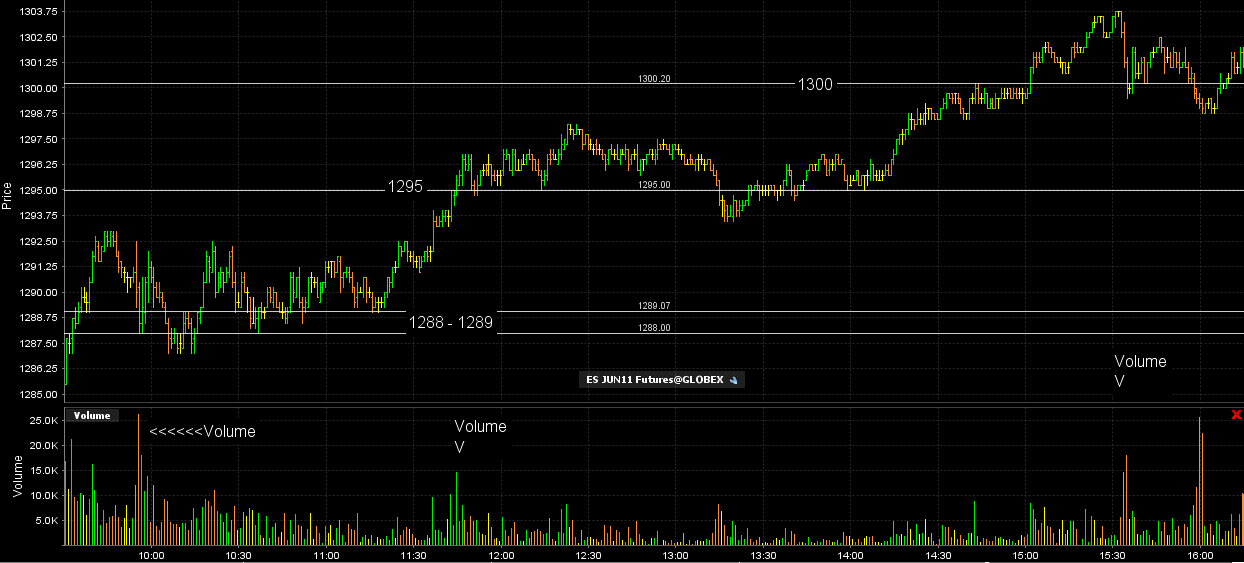
Here are the key numbers from Fridays trade and a chart with the volume showing why they are key. On your own charts you can compare where your high volume is with price.
1300
1295
1288 - 1289
The upper zone not shown on the chart is up near 1308 just in case we rally in the O/N session on Sunday
1300
1295
1288 - 1289
Click image for original size
The upper zone not shown on the chart is up near 1308 just in case we rally in the O/N session on Sunday
This is a very common pattern you will see and that is bigger volume coming into the market infront of a key zone that is step one...then in step two they try to push into the zone and sometimes a bit beyond and the volume diverges ( it dries up and you get a retest of the High volume again) ..in other words they will retest the step one volume
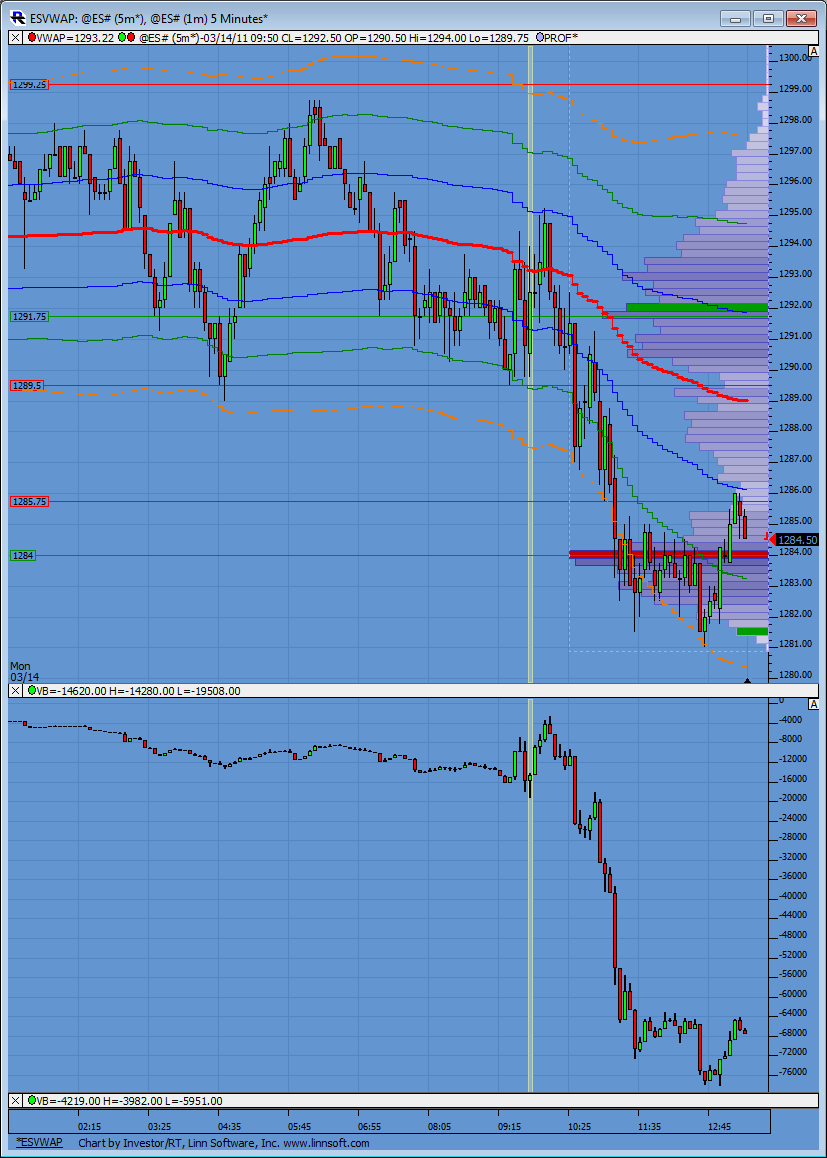
Today examples
Example A....we pushed with the biggest volume at 84 trying to reach down into the key 81 - 82.50 zone...that is step one....then the volume diverges at and below our predefined zone ( the 81 - 82.50)zone and they go back to test the 84 number...so the volume gets used up before they ever reach the key zone
Example B...the highest volume from this mornings RTH early push was at 91.50...that is step one.....then we hit our key number the 95 ( predefined number) and volume disipates and we roll back down to retest the 91.50 and obviously much lower...again the volume is used up before we hit our key number
Example C..now look what happens when we enter the predefined zone of 88 - 89.....we get a big volume surge right through the zone.....not in front of it....VOLUME IS NOT USED UP IN FRONT OF IT..although we still had tests of the zone this is a heads up that the zone may be failing as an attractor/ support level..
The two highest volumes I have that are generated from todays trade are the 84 and the 91.50...I hope those examples make sense to somebody..It's all about volume drying up as they try to stretch away from a key number...and then we try to capitalize when the volatility reverts
I think I need a Red and water after this post.....good luck all!!
Very educational post Bruce, thanks for sharing.
I think they will go back for the 84 volume PT.......that constant movement of low volume to high volume...ebb and flow at it's best
There is PT's LVN getting hit and prices have reversed from it. 1286.25 just so happened to be 2.618 projection up on 5-min chart, as of course Fridays low at 85.50. Pretty series zone right there.
Click image for original size
thanks Dr Rob...I appreciate the feedback
Originally posted by DRob
Very educational post Bruce, thanks for sharing.
that's a great visual Lorn...I have another area at 87.75 - 88.....of volume..I just don't like it when they are so close but if they can hold this 84 as support that we should see the 88 and the 91.50 again...
The volume spikes are just a bit too close right now...so standing aside
The volume spikes are just a bit too close right now...so standing aside
Thanks Bruce, excellent commentary
89-89.25 comes up on all my charts so i might try a short scalp from there
Here is how my simplistic mind finds these key zones...I just simply look for the Volume spikes...I'm not trading any more today so took the effort to label the spikes.....and look now at how the 87 - 88 area is attracting high vertical volume again...so we need to be aware of that
here is the chart
here is the chart
Originally posted by BruceM
that's a great visual Lorn...I have another area at 87.75 - 88.....of volume..I just don't like it when they are so close but if they can hold this 84 as support that we should see the 88 and the 91.50 again...
The volume spikes are just a bit too close right now...so standing aside
Click image for original size

half off at 87.50
carrying the rest to see if the fill the air down at 86.25...stop to b/e
carrying the rest to see if the fill the air down at 86.25...stop to b/e
at least thats what seasonals hint at
Emini Day Trading /
Daily Notes /
Forecast /
Economic Events /
Search /
Terms and Conditions /
Disclaimer /
Books /
Online Books /
Site Map /
Contact /
Privacy Policy /
Links /
About /
Day Trading Forum /
Investment Calculators /
Pivot Point Calculator /
Market Profile Generator /
Fibonacci Calculator /
Mailing List /
Advertise Here /
Articles /
Financial Terms /
Brokers /
Software /
Holidays /
Stock Split Calendar /
Mortgage Calculator /
Donate
Copyright © 2004-2023, MyPivots. All rights reserved.
Copyright © 2004-2023, MyPivots. All rights reserved.