MyPivots
BR
BruceM
Rep: 216,211
Posts: 19,895
Here are the key numbers from Fridays trade and a chart with the volume showing why they are key. On your own charts you can compare where your high volume is with price.

1300

1295

1288 - 1289
Click image for original size
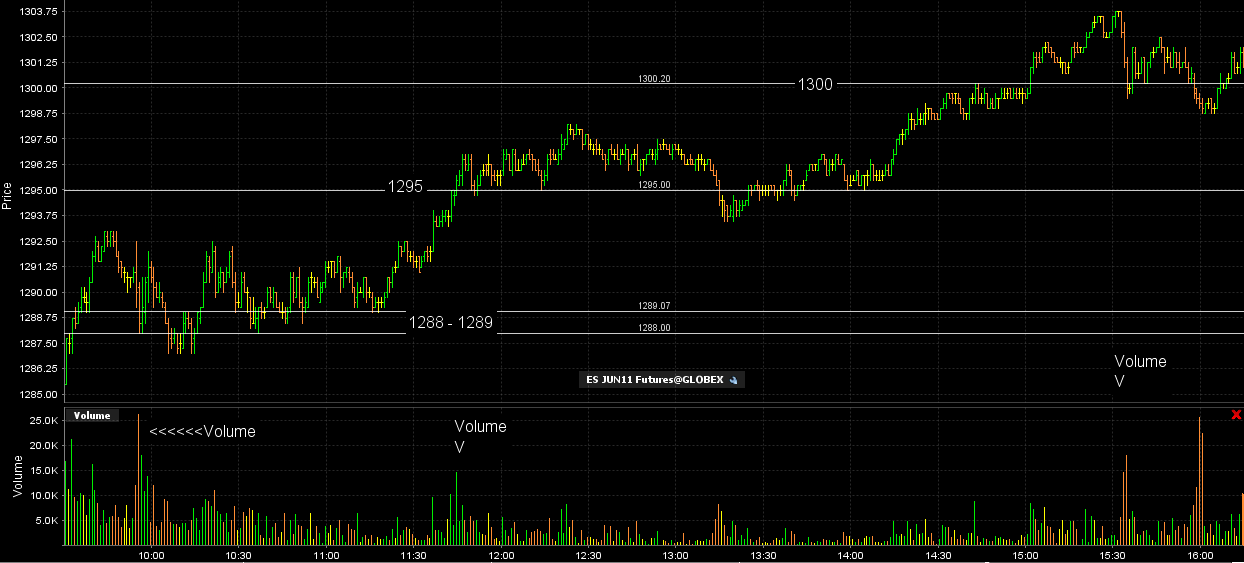


The upper zone not shown on the chart is up near 1308 just in case we rally in the ON session on Sunday
KO
koolblue
Rep: 48,651
Posts: 16,032
i'll take one off at 1285.25... and raise my stop. Being cautious here because of that darn 30 min chart....
OP
optimusprime
Rep: 1,350
Posts: 147
took my 2 @ 1284.75 and running with them. time to get into the office. have a great day everyone. see ya tomorrow. :)
PT
pt_emini
Rep: 5,707
Posts: 1,940
Great Trade Optimus !

New Low Vol Node at 85.75
KO
koolblue
Rep: 48,651
Posts: 16,032
Click image for original size
AP
apk781
Rep: 4,392
Posts: 410
have good confluence from my 5min and 13 min charts still down at 82-82.25...but the 78 munber looms large right below, so longs have to be quite quick imho
BR
BruceM
Rep: 216,211
Posts: 19,895
I have new hV at 84 even......typo in my other post that zone was 81 - 82.50 from Fridays ON
OP
optimusprime
Rep: 1,350
Posts: 147
i agree kool, the 78 level shows up on my 161 extention, i would be very leary of that level especially with all the Chaos going around in Japan,Libya and jordan..any flare-ups and you could slammed. have a great day. AHH i'm late
BR
BruceM
Rep: 216,211
Posts: 19,895
ideal for me would be to have new lows and divergence in Volume to set the long for the 84 retest
KO
koolblue
Rep: 48,651
Posts: 16,032
Click image for original size
AP
apk781
Rep: 4,392
Posts: 410
long from 82
KO
koolblue
Rep: 48,651
Posts: 16,032
at least thats what seasonals hint at