MyPivots
BR
BruceM
Rep: 216,211
Posts: 19,895
Here are the key numbers from Fridays trade and a chart with the volume showing why they are key. On your own charts you can compare where your high volume is with price.

1300

1295

1288 - 1289
Click image for original size
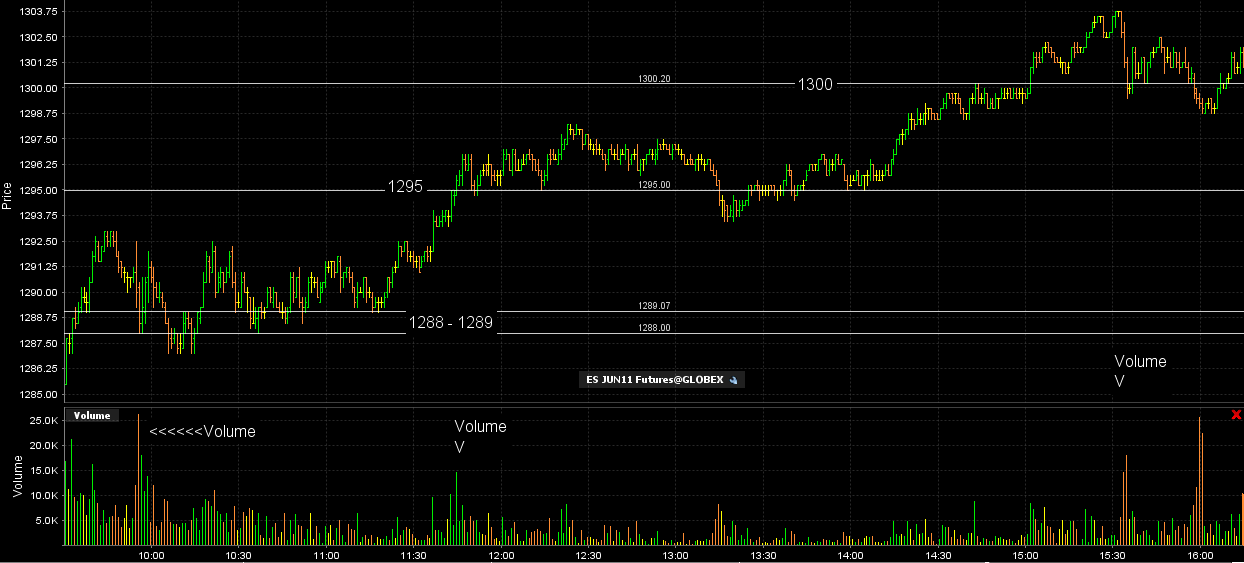


The upper zone not shown on the chart is up near 1308 just in case we rally in the ON session on Sunday
KO
koolblue
Rep: 48,651
Posts: 16,032
note that avg daily range for the last 5 or 10 days is around 22 handles.. and todays high 1300.75-22=1278.75!
OP
optimusprime
Rep: 1,350
Posts: 147
i think i will start looking to buy here at the 1283-1282 level
Click image for original size
KO
koolblue
Rep: 48,651
Posts: 16,032
btw, great call Optimus!!! so far my 1283.25 was hit but no dam fill!
BR
BruceM
Rep: 216,211
Posts: 19,895
Optimus..I have a number also down at 82.50 - 83 as it was a Volume node made by TIME in the ON on friday....
LI
Lisa P
Rep: 6,498
Posts: 1,428
1282.25 = old gap fill
KO
koolblue
Rep: 48,651
Posts: 16,032
Hope so guys!...long now from 1283.25 (usual stop to start)
LI
Lisa P
Rep: 6,498
Posts: 1,428
still looking at old contract for numbers
KO
koolblue
Rep: 48,651
Posts: 16,032
Originally posted by koolblue

Hope so guys!...long now from 1283.25 (usual stop to start)
but keep in mind that 30 min projection!!!
OP
optimusprime
Rep: 1,350
Posts: 147
i'm long 1282.75
LI
Lisa P
Rep: 6,498
Posts: 1,428
so about 6 points to go. Sorry today fingers re faster than brain
KO
koolblue
Rep: 48,651
Posts: 16,032
at least thats what seasonals hint at