ES 03-22-2011
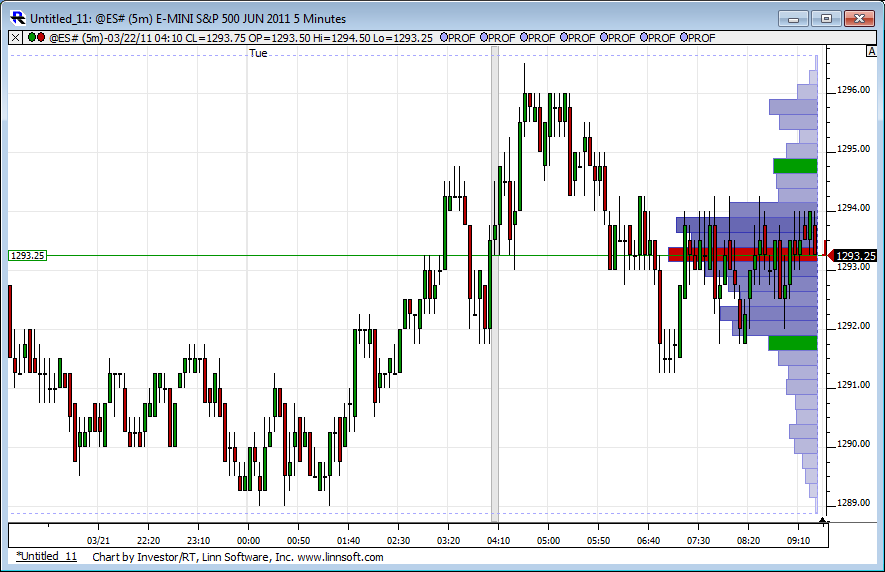
no follow through under YD RTH lows.......big volume couldn't attract sellers....
so Lisa if I assume the above concept that what would the footprint need to show me to confirm my theory and help me get long or at least not hold shorts any more?
so Lisa if I assume the above concept that what would the footprint need to show me to confirm my theory and help me get long or at least not hold shorts any more?
Originally posted by apk781
finally bot the area i mentioned i was looking to buy earlier this morning...though not the same trade i still had to take it... quick scalp long from 87.75...will unload half at 89.25 and the other half at 90 (will move the stop to b/e for the trade whenever first target is hit)
forgot to mention that 90 is the 1.618 proj on the 1m chart (87.5-89 move)...sorry abt that
can somebody help me out here...did SteveO post a trade today or give follow up to the trades from the other day..?
Sorry for the new post, I can't seem to edit my previous one.
I just meant some guidance to go along with the footprint post, not an actual guide as my post reads, sorry.
I just meant some guidance to go along with the footprint post, not an actual guide as my post reads, sorry.
Originally posted by DRob
Hi Lisa,
I am definitely interested as this trading concept is new to me. Also as Bruce said, some guide to go along with how you use the data, or what you're looking at specifically that would make you a buyer/seller would be great. Thanks.
Originally posted by Lisa P
Dear Forum members, please let me know if you are interested in the footprint charts I have been posting. If no one is interested (or very few), I will stop posting. Thanks
Big order entered at 1288. M-Delta shows "at bid". After a slight bounce, retest shows that this short trader did not have the support of ithers - volume dried up to 1 contract. So this probe was not successful. He will either cover (and I will see his 7K contracts exiting a few ticks higher, usually 2-5 on such small order) or he would take some heat and add later.
Click image for original size
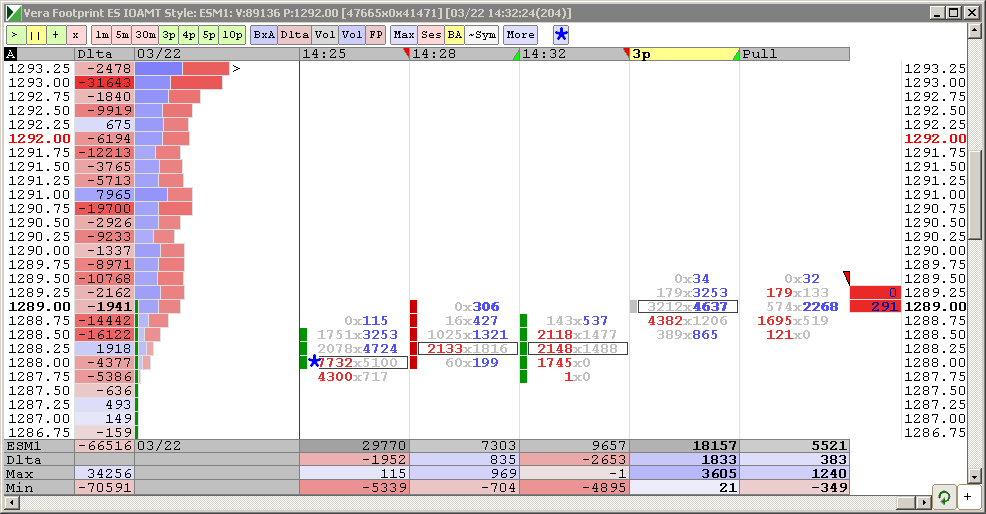
ok that makes sense but why should we assume that they will enter and exit all in one chunk....couldn't they scale back to limit risk in case they are wrong..? in other words get out with a loss at various values of hgher trade....And how do we define "BIG" is that relative to a days volume picture in general?
Originally posted by Lisa P
Big order entered at 1288. M-Delta shows "at bid". After a slight bounce, retest shows that this short trader did not have the support of ithers - volume dried up to 1 contract. So this probe was not successful. He will either cover (and I will see his 7K contracts exiting a few ticks higher, usually 2-5 on such small order) or he would take some heat and add later.
Click image for original size
back! Im interested in your charts, Lisa,fwiw!... well the longer term studies continue to pile up ,reinforcing my view that new yearly highs are coming soon! Still believe we head down first tho! last week small speculators on the s&p futures reduced their long holdings by the 4th largest amount of all time last week! (small speculators are usually wrong!) meanwhile commercials(usually right) increased!
HEre we are - looks like he exited. However, this is the area of the previous LOD, so there may be some residual orders from the morning LOD order. If so they may show as "on bid", but really they were sitting still there. In those areas it is hard to tell - easier when there is no "reference points"
Click image for original size

currently trying to sell 1290.00
lisa is that a real traded order or only a placed one.
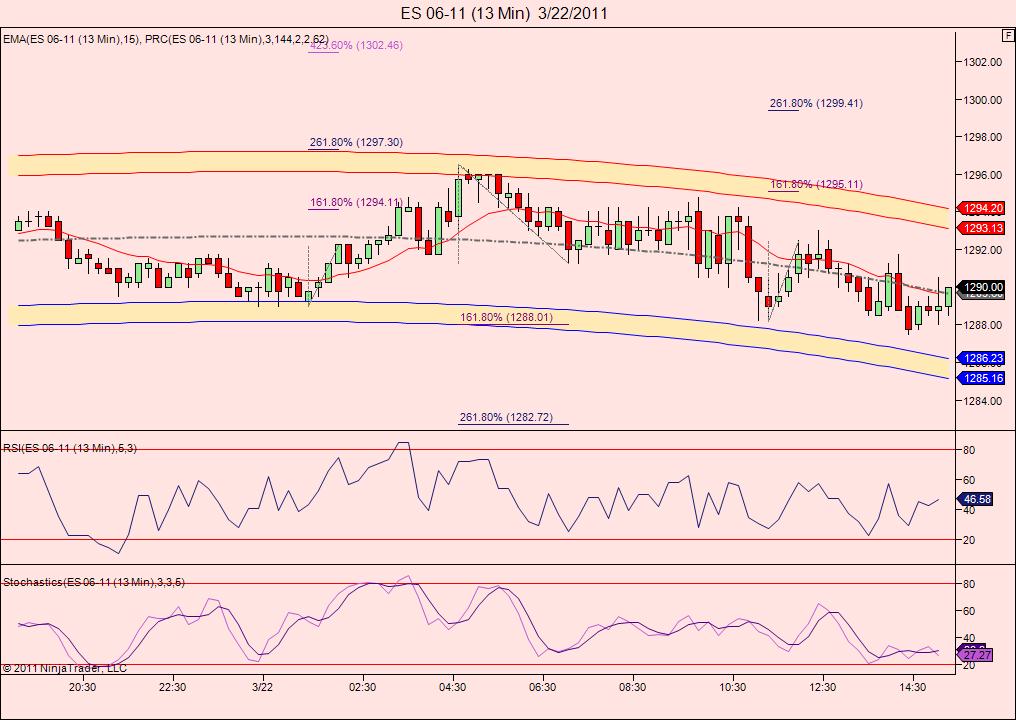
Originally posted by koolbluebingo!(within one tick... this is the important dividing line imho!... if 1283 doesnt hold then down we go, otherwise bulls still have hope here!
once again caution is the watchword! as the charts are mildly negative,but we just had nice pos. divergencies at the last low!...
Click image for original size
Emini Day Trading /
Daily Notes /
Forecast /
Economic Events /
Search /
Terms and Conditions /
Disclaimer /
Books /
Online Books /
Site Map /
Contact /
Privacy Policy /
Links /
About /
Day Trading Forum /
Investment Calculators /
Pivot Point Calculator /
Market Profile Generator /
Fibonacci Calculator /
Mailing List /
Advertise Here /
Articles /
Financial Terms /
Brokers /
Software /
Holidays /
Stock Split Calendar /
Mortgage Calculator /
Donate
Copyright © 2004-2023, MyPivots. All rights reserved.
Copyright © 2004-2023, MyPivots. All rights reserved.