ES 3-24-2011
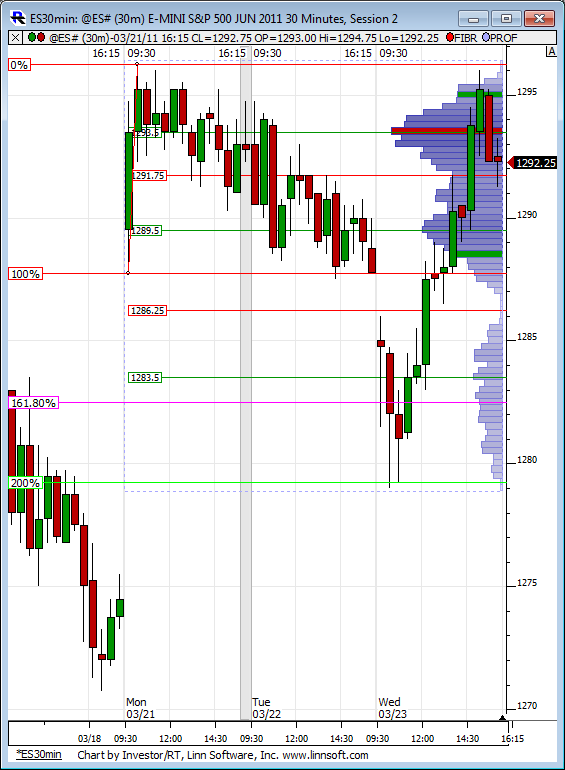
Here is the developing RTH weekly profile. Obviously prices are well above this at the moment. Also on the chart is Paul's Monday Range fib extension where if prices reach the 1.618 extension of Monday's RTH range on either side the probabilities of prices hitting the 2.000 range are extremely high during the rest of the week. In this case to the tick almost!
Click image for original size
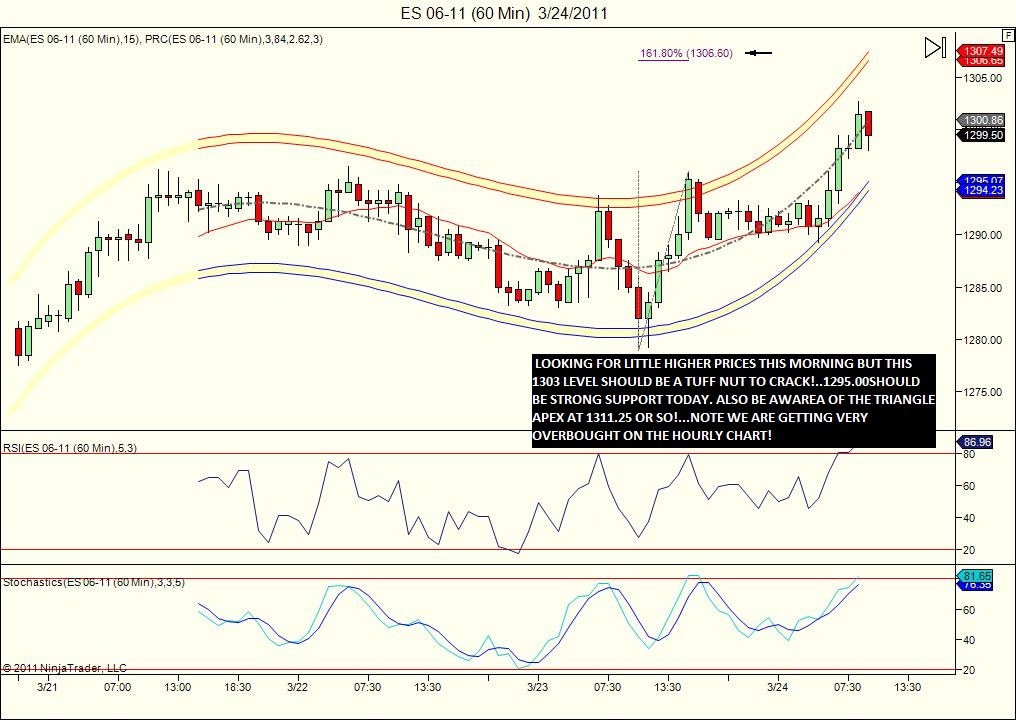
Good morning! All along the recent decline from 1337 to 1241 i harped on the fact that it would likely be a supreme buying opportunity with higher prices due in April...i still believe that. the first phase of the rally(what wave theorists call wave one) is probably nearly over. The 1303 area is considerable resistance ,but i tend to think we top out a little higher..perhaps the triangle apex ? Afterward expect a swift decline for wave 2 of perhaps 38% from 1241 to wherever the high is!.. Heres the hourly picture so far...
Click image for original size
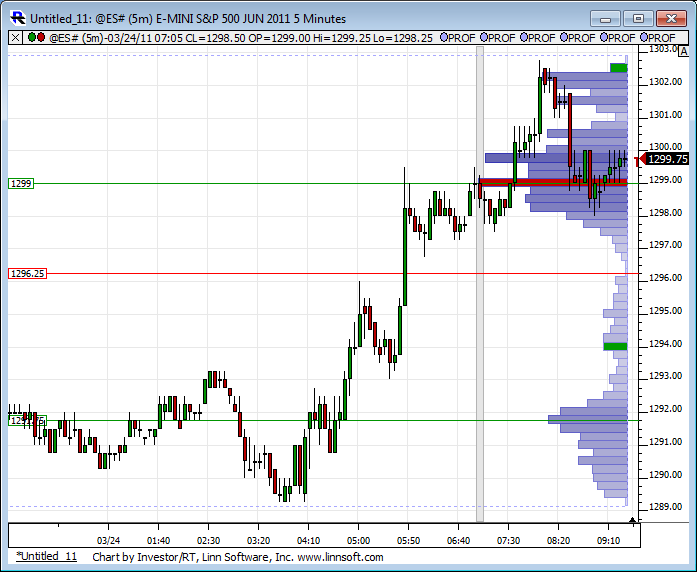
I just went long at 1298.50 afew min ago because it was first support....
Click image for original size
Will be looking for a Long setup at Lorn's 1296.25 low volume node.
yeah, P.T., I will be trying slightly lower at 1295.00-1295.50. I wanted to take one off at 1300.00 because of the one min initial move from 1298.00 to 1299.25 (1.618=1300.00) but missed it due to posting!ugh! then i would have raised my stop on the runner looking for 2.618 at 1291.25!... As it stands i was stopped out at 1297.00 for a small loss!
Nice call P.T. and Lorn! 1296 is of course the 'gap' fill and theoratically should be of some support! Itake note of the fact that daily notes page here at mypivots shows the avg daily range recently of about 21.50 handles and with the daily low at 1289.25 do da maff! More reason to expect apex getting hit?
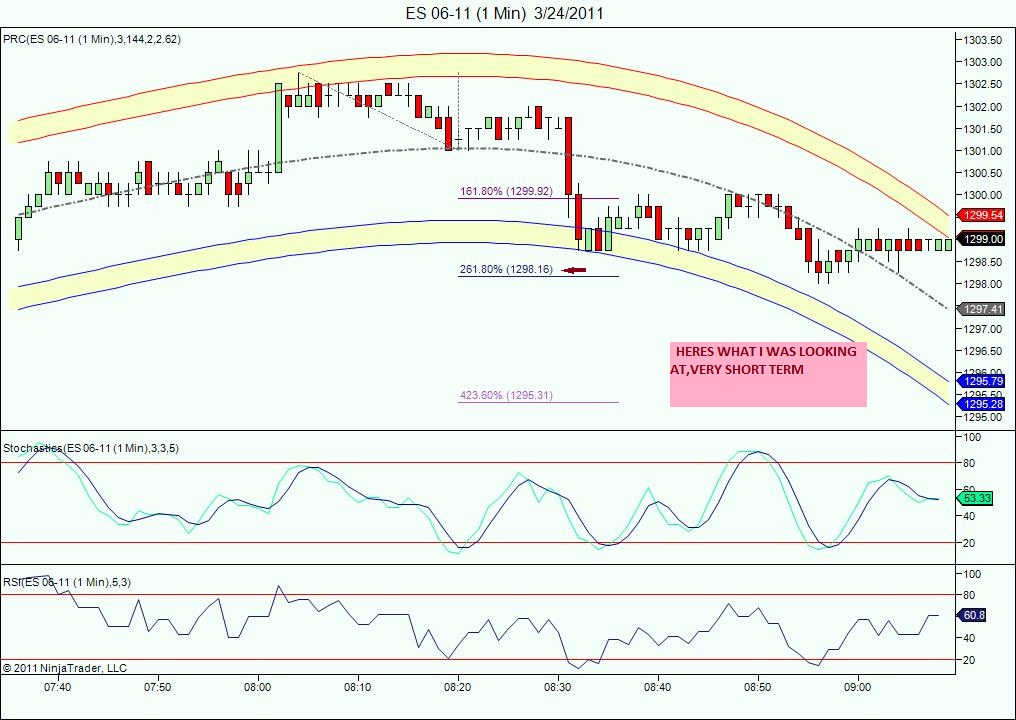
there it is! Long now from 1295.50...
This is a 5 min prc buy! and the one min chart shows pos. divergence on the rsi, so im hopeful here!
Originally posted by koolblue
Nice call P.T. and Lorn! 1296 is of course the 'gap' fill and theoratically should be of some support! Itake note of the fact that daily notes page here at mypivots shows the avg daily range recently of about 21.50 handles and with the daily low at 1289.25 do da maff! More reason to expect apex getting hit?
Hi KB. Isn't the gap from yesterday's close at 1292.0? Where is a gap at 1296 from? TY.
Originally posted by prestwickdriveTechnically ,yes, but i was referring to yesterdays high at 1296.00. For me, (and a few other 'gap' people) when ever we have a gap outside of the previous days range,ie: the high of the day, the odds are for a decent, perhaps even trend day up.Also generally the gap isnt always filled. If the gap is within the previous days range, it generally indicate a non trending market. ps: still alive on this long with my usual starting stop.
Originally posted by koolblue
Nice call P.T. and Lorn! 1296 is of course the 'gap' fill and theoratically should be of some support! Itake note of the fact that daily notes page here at mypivots shows the avg daily range recently of about 21.50 handles and with the daily low at 1289.25 do da maff! More reason to expect apex getting hit?
Hi KB. Isn't the gap from yesterday's close at 1292.0? Where is a gap at 1296 from? TY.
s&p 500 cash high today...1311.34! Thats now a magnet,imho!
Emini Day Trading /
Daily Notes /
Forecast /
Economic Events /
Search /
Terms and Conditions /
Disclaimer /
Books /
Online Books /
Site Map /
Contact /
Privacy Policy /
Links /
About /
Day Trading Forum /
Investment Calculators /
Pivot Point Calculator /
Market Profile Generator /
Fibonacci Calculator /
Mailing List /
Advertise Here /
Articles /
Financial Terms /
Brokers /
Software /
Holidays /
Stock Split Calendar /
Mortgage Calculator /
Donate
Copyright © 2004-2023, MyPivots. All rights reserved.
Copyright © 2004-2023, MyPivots. All rights reserved.