ES 3-24-2011
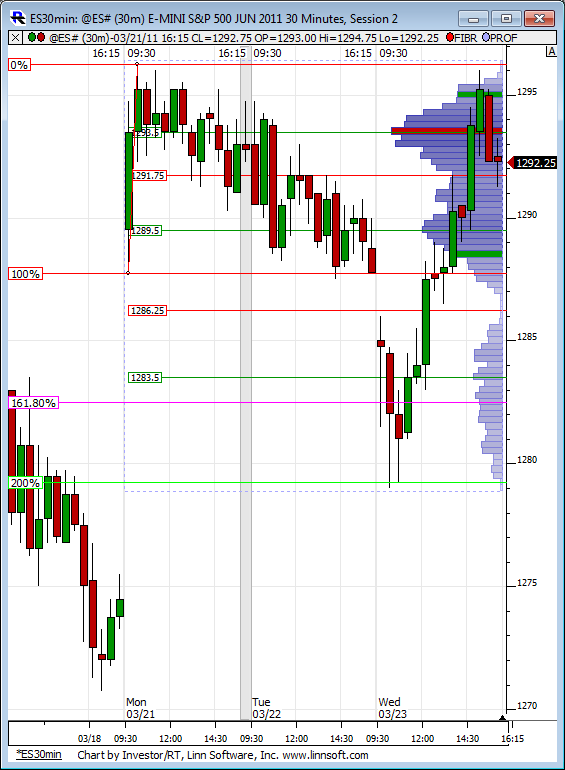
Here is the developing RTH weekly profile. Obviously prices are well above this at the moment. Also on the chart is Paul's Monday Range fib extension where if prices reach the 1.618 extension of Monday's RTH range on either side the probabilities of prices hitting the 2.000 range are extremely high during the rest of the week. In this case to the tick almost!
Click image for original size
Sorry Bruce, my chart looks different
I onlyhave RTH session Lorn..is that what you are showing or can u show me just the RTH session for today.....I suspect my data is off...Damn IB!!
Originally posted by Lisa P
Sorry Bruce, my chart looks different
What data feed are you using Lisa ?
Large order
Click image for original size


you maybe right Lisa but it seems to me they are accepting the big order that you have shown...just below the O/N high and I also have the 06 - 08 as a magnet...lots of volume in the 1302 area....but certainly hope it rolls over for those holding shorts up here
Yea, Lisa, Bruce I highly recommend you use DTN data feed as tick data is unfiltered and unpacked.
I have cummulative delta highs at about 30,585.....is that even close? Yikes
BRuce, we are at the bottom of an old gap - so they may close when the book is thin (lunch). You may be better off by exiting this trade. I am still in it... :-(
s&p 500 cash high today...1311.34! Thats now a magnet,imho!
Emini Day Trading /
Daily Notes /
Forecast /
Economic Events /
Search /
Terms and Conditions /
Disclaimer /
Books /
Online Books /
Site Map /
Contact /
Privacy Policy /
Links /
About /
Day Trading Forum /
Investment Calculators /
Pivot Point Calculator /
Market Profile Generator /
Fibonacci Calculator /
Mailing List /
Advertise Here /
Articles /
Financial Terms /
Brokers /
Software /
Holidays /
Stock Split Calendar /
Mortgage Calculator /
Donate
Copyright © 2004-2023, MyPivots. All rights reserved.
Copyright © 2004-2023, MyPivots. All rights reserved.