ES 3-24-2011
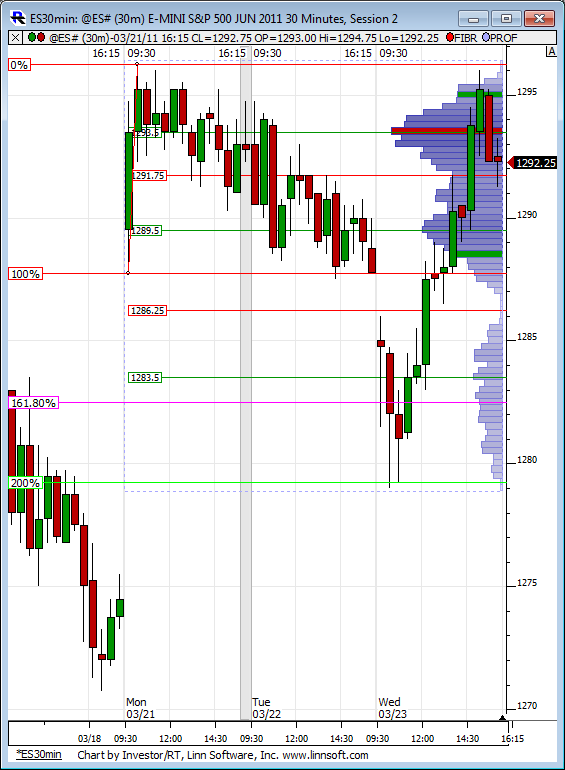
Here is the developing RTH weekly profile. Obviously prices are well above this at the moment. Also on the chart is Paul's Monday Range fib extension where if prices reach the 1.618 extension of Monday's RTH range on either side the probabilities of prices hitting the 2.000 range are extremely high during the rest of the week. In this case to the tick almost!
Click image for original size
Click image for original size
I don't even know where you got in perhaps I missed a post as usual.....I exited at 1301.75 as posted earlier......too stressful with data problems and I had that initial 1299.25 entry....so I'm not in the mood for heat up here...
Originally posted by Lisa P
BRuce, we are at the bottom of an old gap - so they may close when the book is thin (lunch). You may be better off by exiting this trade. I am still in it... :-(
Originally posted by Lisa P
PT, I am using IB data feed (unfortunately) and Market Delta charts. Unhappy with the IB feed.
Yeah IB is really rough to work with when it comes to these volume studies. They heavily filter the data stream.
Zenfire does work with Market Delta, might be worth a look on your part.
agree about DTN Lorn....I was on the phone with IB for a while yesterday and they assured me that the way I was looking at Cummulative delta it would work but it doesn't seems so....also there is no back fill with IB with cummulative delta so I'd have to run my computers all the time to collect data
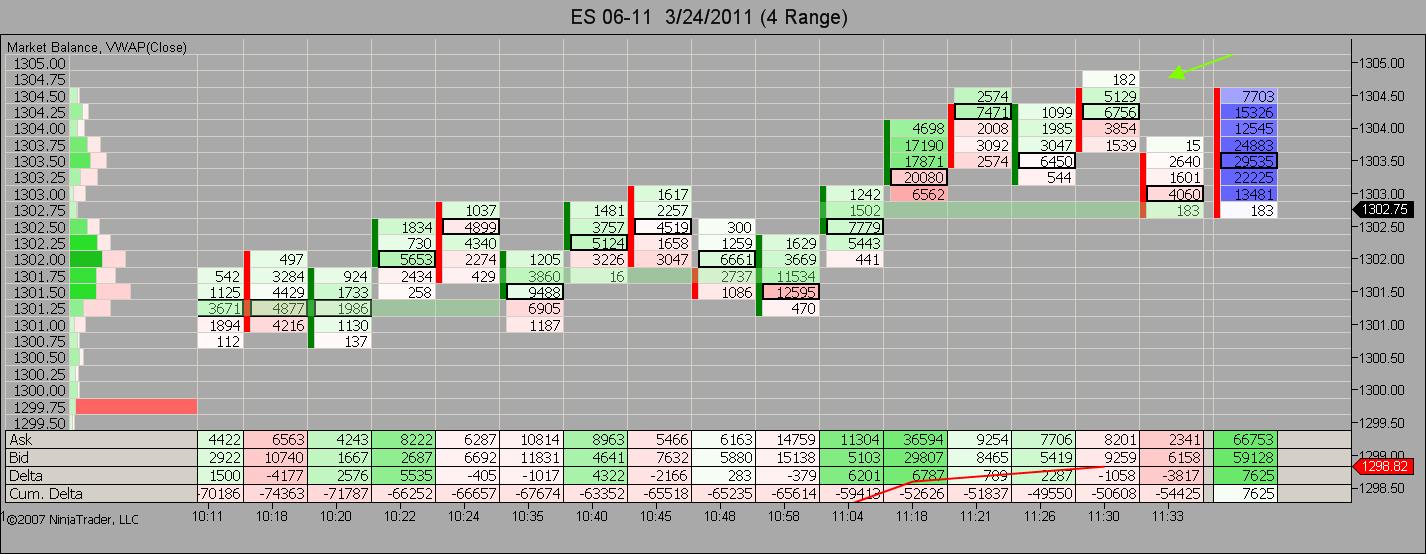
Dipping a toe in on the short side here on this retest of the 1304.50 level
Originally posted by BruceM
agree about DTN Lorn....I was on the phone with IB for a while yesterday and they assured me that the way I was looking at Cummulative delta it would work but it doesn't seems so....also there is no back fill with IB with cummulative delta so I'd have to run my computers all the time to collect data
I am running zenfire which does not provide any historical backfill either. I start my volume studies around 8:30-9:00 am (Eastern Time) most mornings and have no problem with that at all. Volume overnight (globex session) is so low that many volume studies do not work right anyways.
I use DTN for data also. For others either using or considering using them, they and the CME offer a break on CME data fees in cooperation with several brokers. It saves me a fair amount of money a year and if anyone is interested in learning more about it, check out this link:
http://www.iqfeed.net/index.cfm?displayaction=data§ion=feewaiver
I am not affiliated with them and only mention this in case it can help fellow traders.
http://www.iqfeed.net/index.cfm?displayaction=data§ion=feewaiver
I am not affiliated with them and only mention this in case it can help fellow traders.
Originally posted by pt_emini
Dipping a toe in on the short side here on this retest of the 1304.50 level
Short entry setup on delta chart...
Notice the retest of prior high (1 tick) but no acceptance then reversal back down (price rejection)...
Click image for original size
I was gonna mention this also Prestwick.
Originally posted by prestwickdrive
I use DTN for data also. For others either using or considering using them, they and the CME offer a break on CME data fees in cooperation with several brokers. It saves me a fair amount of money a year and if anyone is interested in learning more about it, check out this link:
http://www.iqfeed.net/index.cfm?displayaction=data§ion=feewaiver
I am not affiliated with them and only mention this in case it can help fellow traders.
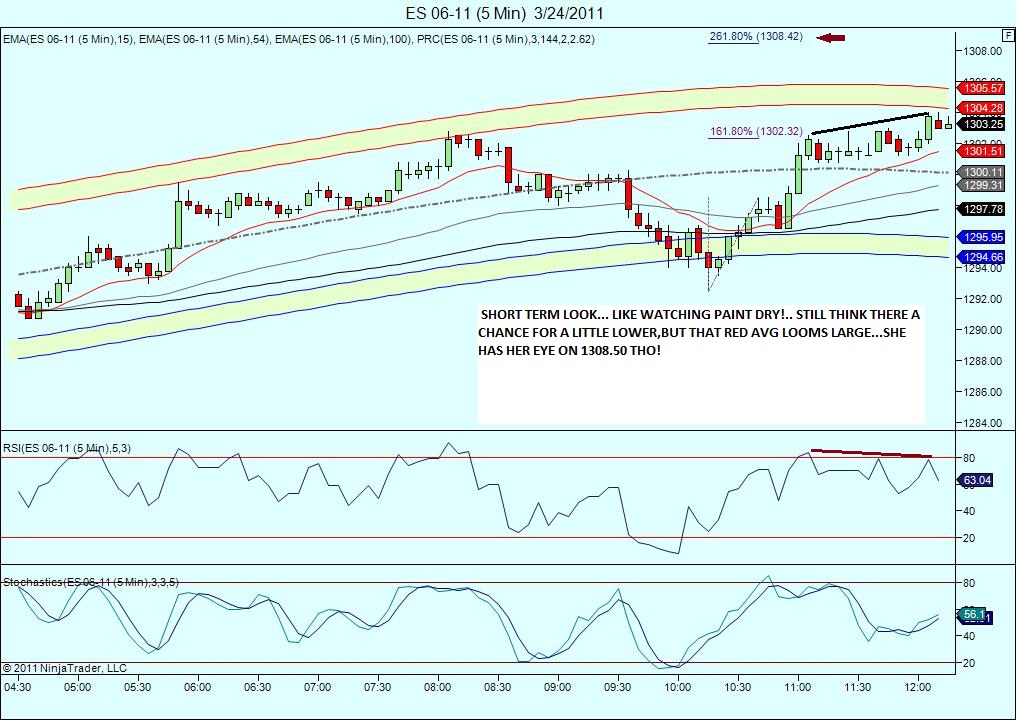
On the upside ,we still have that 1306.00 proj from earlier, 1308.50, more recent and of course, 1311.25.the downside appears limited. here is a look at 15 min intervals.. almost there! but probably not quite!...
Click image for original size

Click image for original size
...
s&p 500 cash high today...1311.34! Thats now a magnet,imho!
Emini Day Trading /
Daily Notes /
Forecast /
Economic Events /
Search /
Terms and Conditions /
Disclaimer /
Books /
Online Books /
Site Map /
Contact /
Privacy Policy /
Links /
About /
Day Trading Forum /
Investment Calculators /
Pivot Point Calculator /
Market Profile Generator /
Fibonacci Calculator /
Mailing List /
Advertise Here /
Articles /
Financial Terms /
Brokers /
Software /
Holidays /
Stock Split Calendar /
Mortgage Calculator /
Donate
Copyright © 2004-2023, MyPivots. All rights reserved.
Copyright © 2004-2023, MyPivots. All rights reserved.