ES 3-24-2011
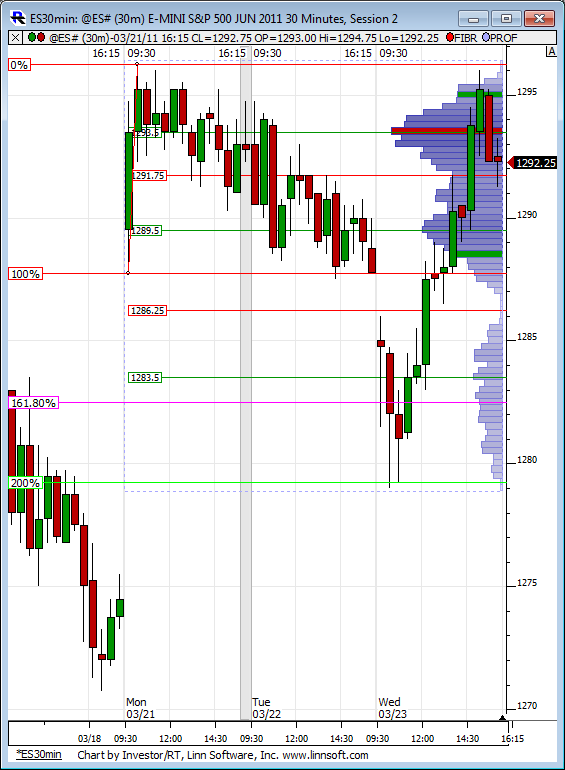
Here is the developing RTH weekly profile. Obviously prices are well above this at the moment. Also on the chart is Paul's Monday Range fib extension where if prices reach the 1.618 extension of Monday's RTH range on either side the probabilities of prices hitting the 2.000 range are extremely high during the rest of the week. In this case to the tick almost!
Click image for original size
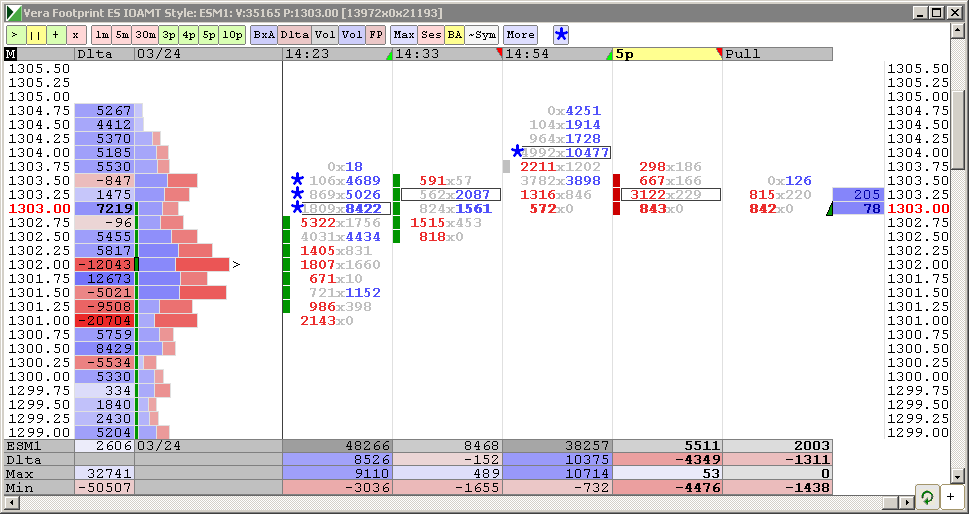
selling above 1303.50...seems like we are attatched to the 1302 level for now...but would like 1300 retest...my only concern is the structure...we have tested the IB high twice and held both times...and of course a possible run to 1306 is not good for this
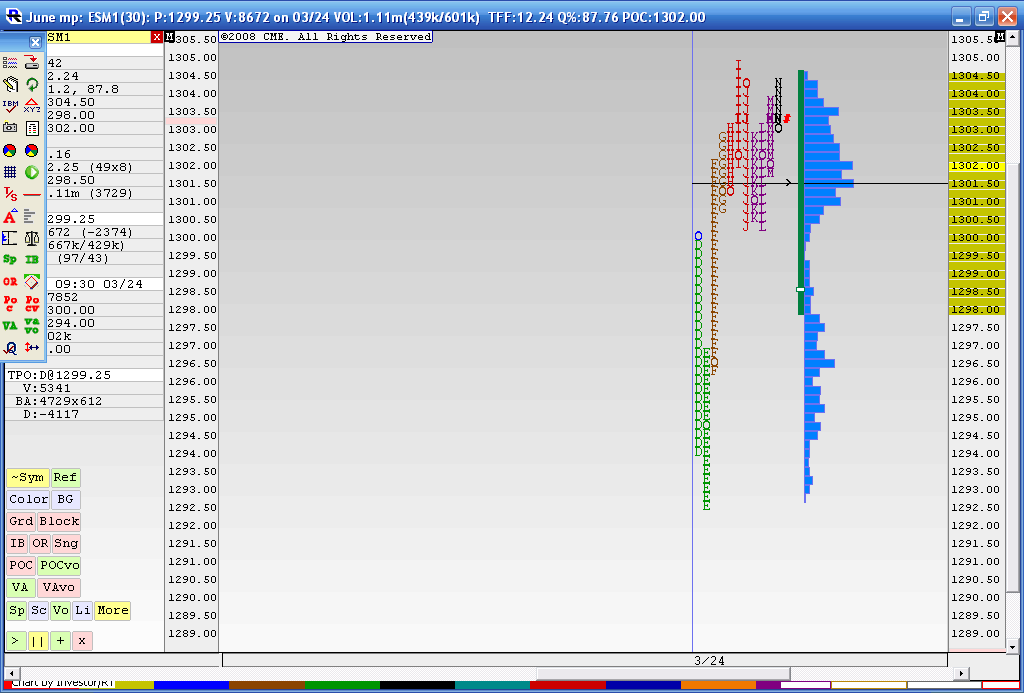
as usual there is a flip side to everything ..if we break up the "P" pattern we will see a double low at the 60 minute high periods....that doesn't show buyers in a rush to get long....and then we have excess on the highs...so far...so perhaps the sellers will get more aggressive again...as we approach the highs...volume is dreadful..
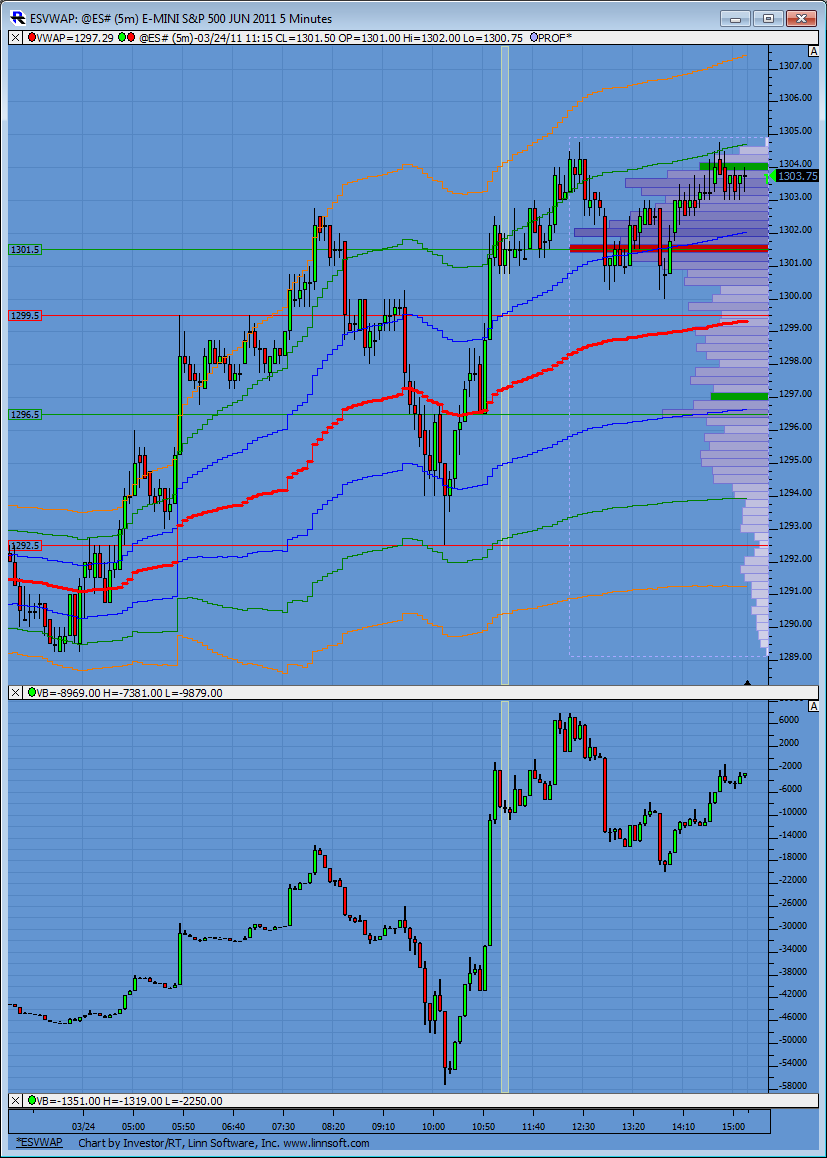
here is the "P" pattern trying to play out....note the blue volume distribution to the right of the profile...gotta be careful with these because the market alternates between trend and consolidation....so we don't want to get caught if/when this trends especially if it is to the upside.....you can see those double lows in J and L period that has been support against the IB high...Ideal runner would get that far...and that may be asking a lot
Click image for original size
Careful with shorts here
Click image for original size
1301 is secondary target..first target revised to 02.25...but we have poor structure on both sides now....a double top is trying to form on this 30 minute bar.....not a great sign of sellers being agressive either
Just noticed: first move advanced 2.5 points above O/N hihg; second move advanced ZERO over the first move. Hmmmm
YM made a lower high
hey Lorn is you CD showing a big divergence up here...Price higher and CD much lower......Looks like I picked a bad day to incorporate new ideas...zoinks!!
I never like those kinds of highs....just seems too obvious for them not to run stops above there
Originally posted by Lisa P
Just noticed: first move advanced 2.5 points above O/N hihg; second move advanced ZERO over the first move. Hmmmm
s&p 500 cash high today...1311.34! Thats now a magnet,imho!
Emini Day Trading /
Daily Notes /
Forecast /
Economic Events /
Search /
Terms and Conditions /
Disclaimer /
Books /
Online Books /
Site Map /
Contact /
Privacy Policy /
Links /
About /
Day Trading Forum /
Investment Calculators /
Pivot Point Calculator /
Market Profile Generator /
Fibonacci Calculator /
Mailing List /
Advertise Here /
Articles /
Financial Terms /
Brokers /
Software /
Holidays /
Stock Split Calendar /
Mortgage Calculator /
Donate
Copyright © 2004-2023, MyPivots. All rights reserved.
Copyright © 2004-2023, MyPivots. All rights reserved.