ES 3-24-2011
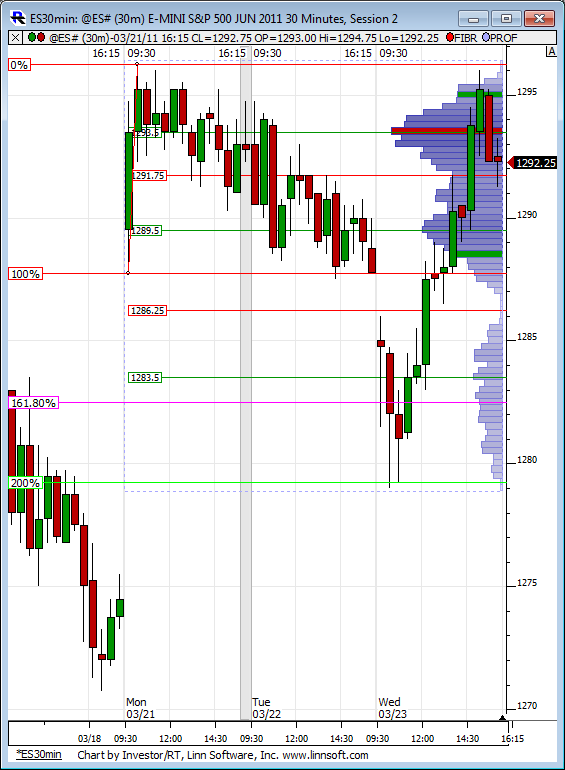
Here is the developing RTH weekly profile. Obviously prices are well above this at the moment. Also on the chart is Paul's Monday Range fib extension where if prices reach the 1.618 extension of Monday's RTH range on either side the probabilities of prices hitting the 2.000 range are extremely high during the rest of the week. In this case to the tick almost!
Click image for original size
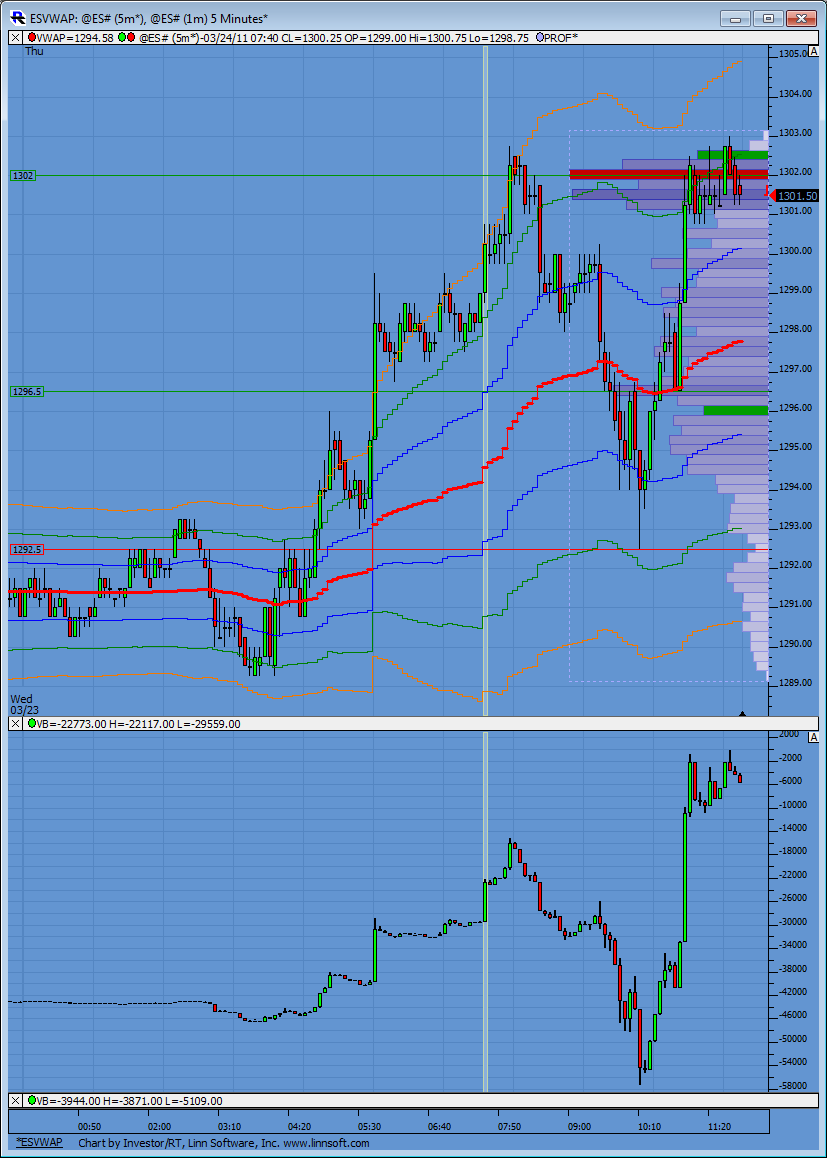
have my stop at 1303.75.....this has to go now...I'm showing volume divergence up here and cummulative delta...Ib rep says that my data will work for Cummulative delta but I'm not convinced so far today
PT, Delta con be set manually for any return number. IF I get mere screen real estate, I will put also 10-tick return. It is like having small time frame, say 3-min, and a larger time frame, say 30 min.
5min charts (ym, es) on their exhaustion waves here with clear dvg coming from long term macd indicators...a/d at only 1000 does not indicate a killer trend so that lt dvg is likely to play a role here...that said a final push up to 1306 area could still happen and that is where i would love to sell some (1.618 proj on longer term charts)...also decent resistnace on ym at 131 (some 35-40 pts away from where ym currently stands) which looks likely to coincide with the 1306 area on es
Originally posted by Lisa P
PT, Delta is not time based - it is more like "point and figure " chart. Actually it is a point and figure chart.
Mine is set to 5-tick return, meaning that if market moves more than 5 ticks in the opposite direction, chart starts a new column.
Hope that helps.
Yes makes perfect sense !
Thank you.
BruceM, I have 1303.75 as the old gap's bottom. You may wish to give it a couple of ticks if price "smudges". Just a suggestion. They smudge a lot these days. I am also stuck in the short trade, so feel for you. Guess we are both stubborn.
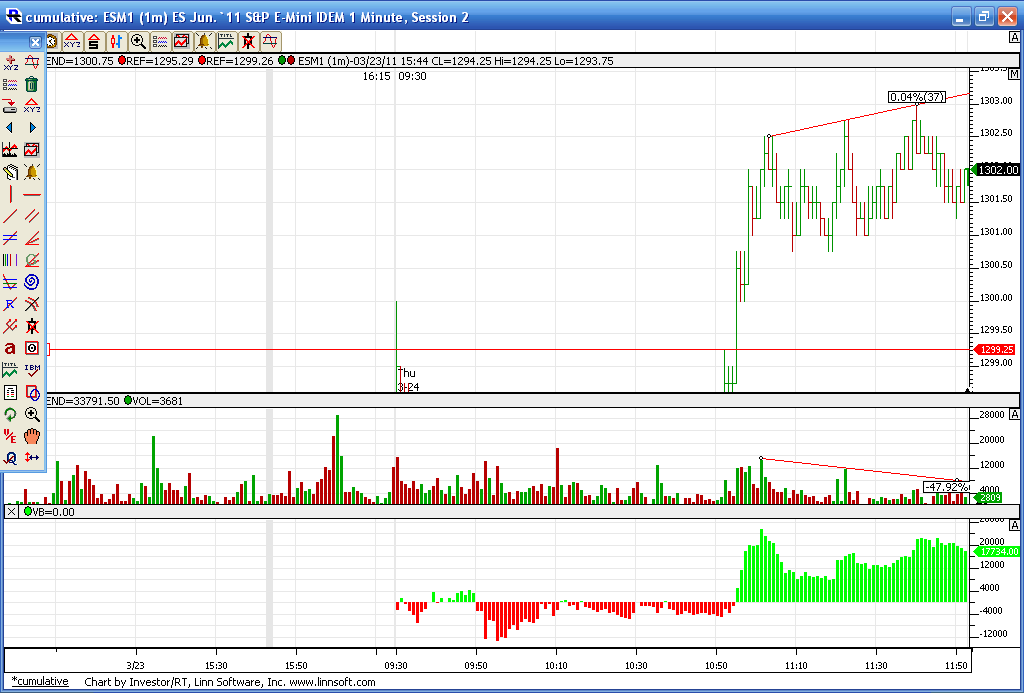
could one of you confirm the look of my Cummulative delta....bottom pane
of my chart..I can't get rid of trendline % numbers but here is what it looks like here at the highs and the key area..just wantto know if it even looks accurate
of my chart..I can't get rid of trendline % numbers but here is what it looks like here at the highs and the key area..just wantto know if it even looks accurate
Click image for original size
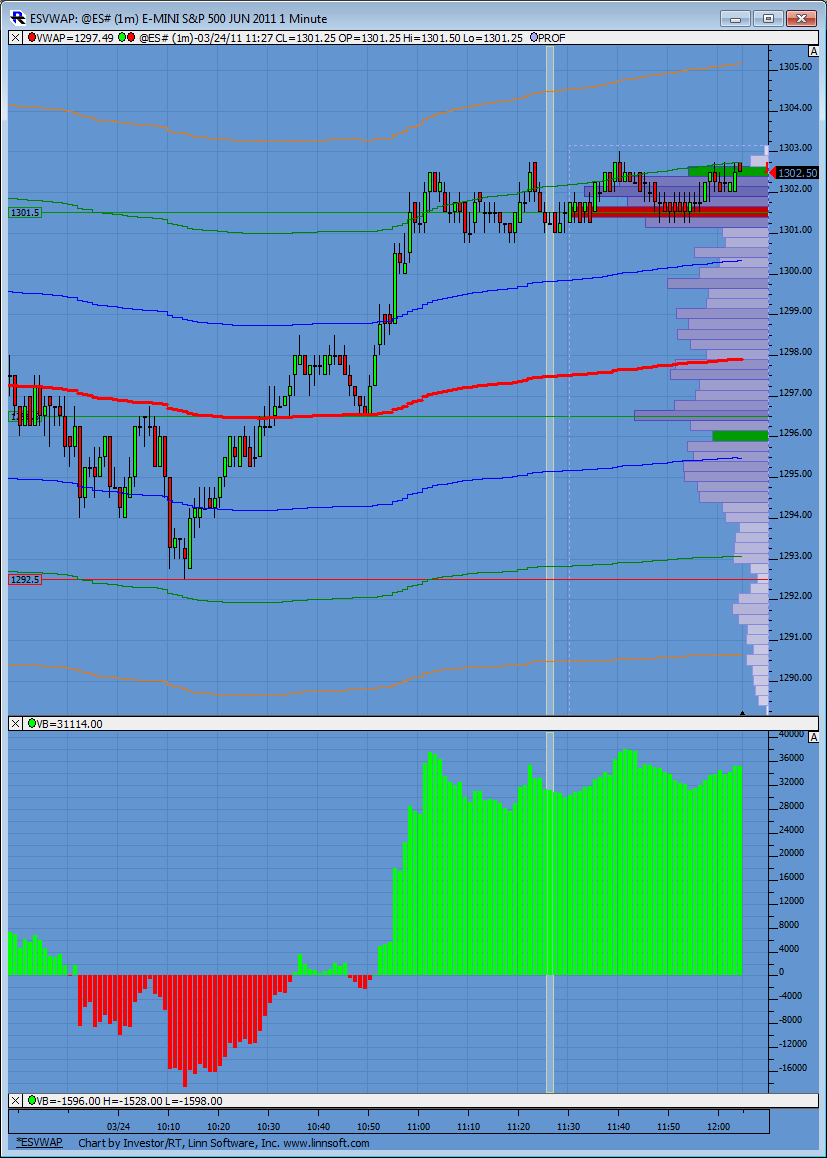
we are 10 points up from the LOD without a pullback
exited at 1301.75....data issues..
s&p 500 cash high today...1311.34! Thats now a magnet,imho!
Emini Day Trading /
Daily Notes /
Forecast /
Economic Events /
Search /
Terms and Conditions /
Disclaimer /
Books /
Online Books /
Site Map /
Contact /
Privacy Policy /
Links /
About /
Day Trading Forum /
Investment Calculators /
Pivot Point Calculator /
Market Profile Generator /
Fibonacci Calculator /
Mailing List /
Advertise Here /
Articles /
Financial Terms /
Brokers /
Software /
Holidays /
Stock Split Calendar /
Mortgage Calculator /
Donate
Copyright © 2004-2023, MyPivots. All rights reserved.
Copyright © 2004-2023, MyPivots. All rights reserved.