Phileo's Notes
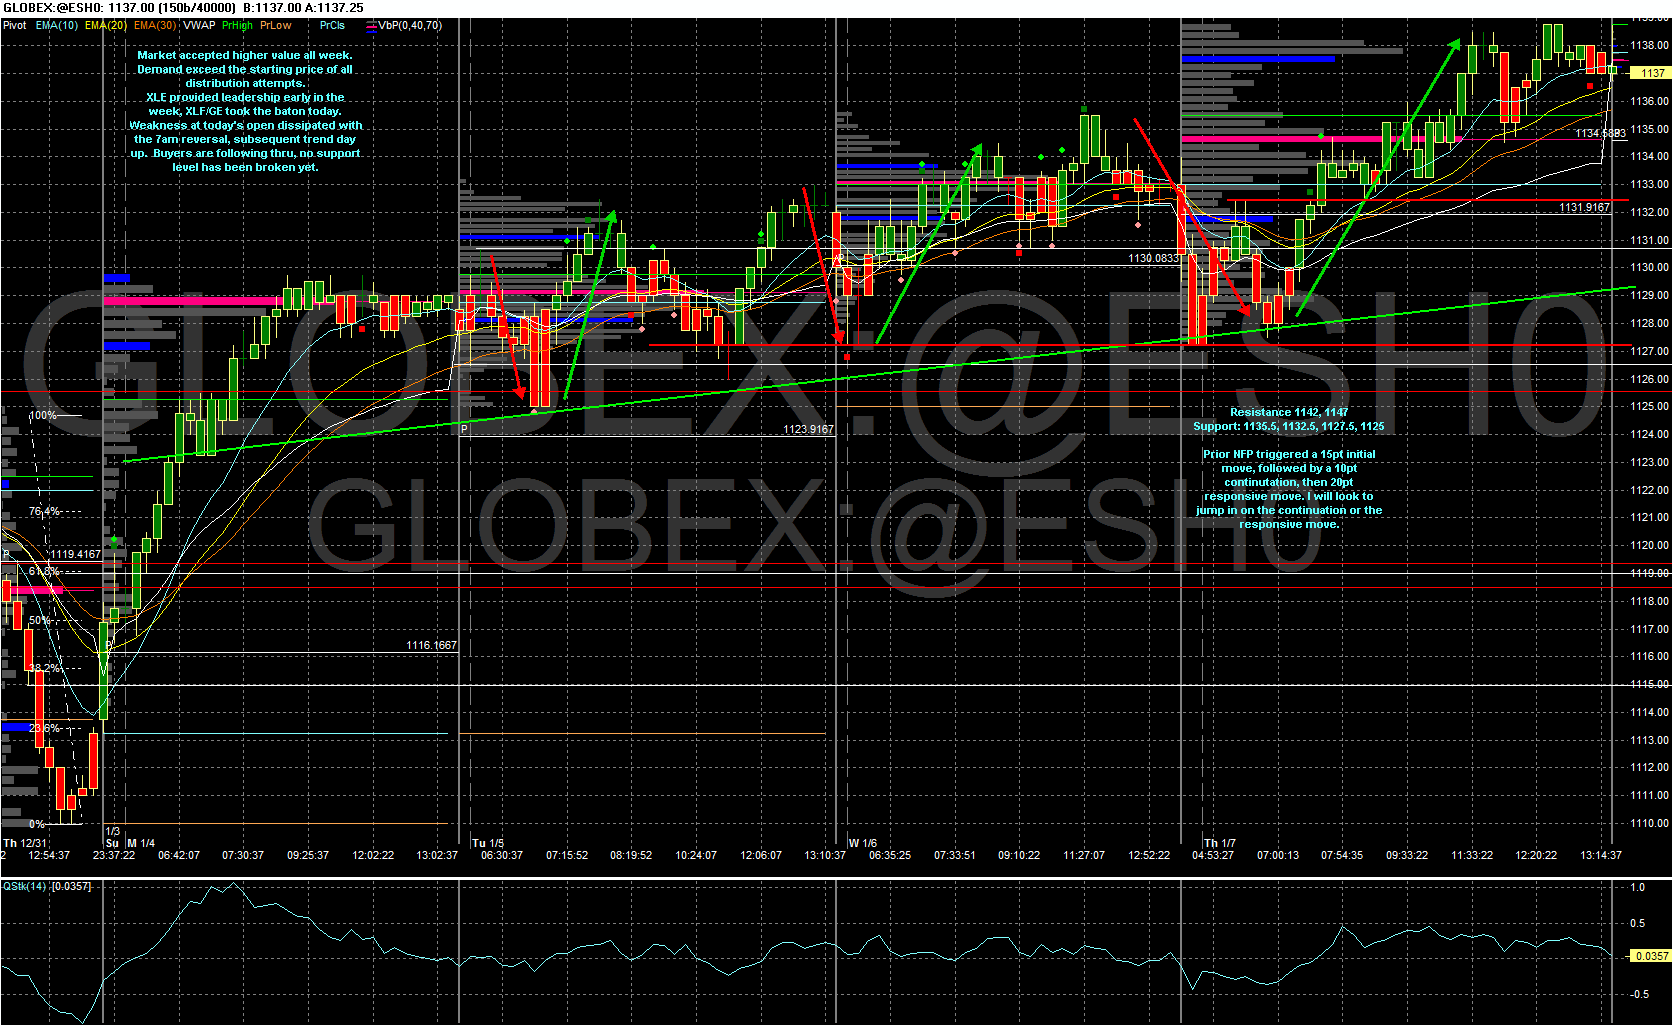
Here is the chart leading up to tomorrow`s NFP day Jan 8, 2010
A few notes:
- 4 consecutive higher lows (although today's low was equal to Wed's. low)
- US Dollar Index has been trending higher since Tues.
- ES has been stronger than, and thus leading NQ higher this week.
- Dec31 was the successful test of the breakout from the prior 6wks of consolidation (1085 - 1112 range)
- Individual names (BAC, GE, GS) and sectors (XLE, XLF, XLI) have taken turns at providing leadership.
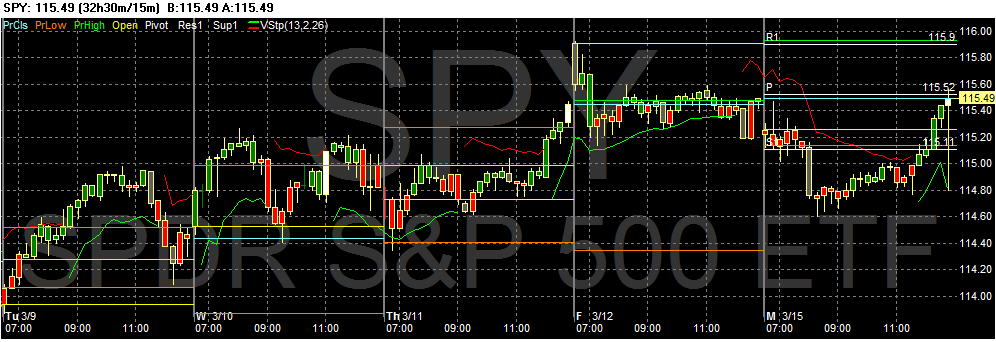
Here is the context leading up to FOMC day:
- failed breakout friday, probe for support led back into last week's range
- trend of the past 2 weeks is clearly up; however, the trend of the past 4 session is sideways.
- 1146 is a Point of contention, as the market closed around that level for the 3rd consecutive session.
- Both NQ and TF are below Friday's close.
- a majority of the leadership stocks (AAPL, GS, GOOG) have unfilled gaps and closed below Friday's levels. SMH, GDX, and XLE are also below Friday's close.
- both NYMO and NYAD are at levels where previous corrections have started.
- TraderVic 2B Top watch: a close below 1134 (10d EMA=1135.25)
Resistanced levels: 1148.5, 1151, 1155
Support levels: 1134, 1137.5, 1140.5
my best guess: knee jerk spike up above 1151, then responsive move down. However, regardless if it is up or down, I believe the responsive move will be the best move to trade, a range expansion potential of 15points or more.
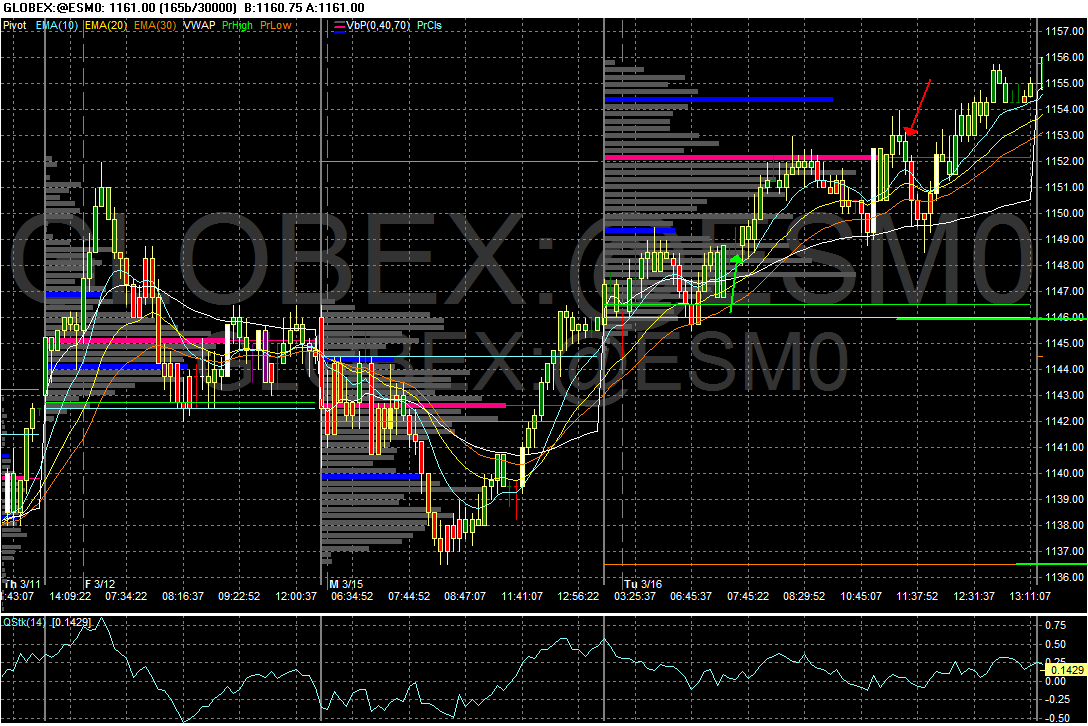
So here's what happened on FOMC day:
Notes:
- +3pt initial move, -4pt responsive move, then a muddy double bottom leading to a +6pt continuation move in the same direction as initial move.
- trend day up.
- pre-FOMC range 7pts, post-NFP range 6.5pts
- afternoon rally led to +ve close the day before FOMC day, overnight GLOBEX bias was up prior to open, opening pb that was bought before 7am reversal, leading to trend day up prior to FOMC announcement.
- broke to new contract highs post-FOMC.
- Tuesday's FOMC session opened with a gap up which was filled very efficiently. historical probabilities of a gap fill:
-> Opening between R1 and PP: 82%
-> gap up to open FOMC day: 52%
-> Tuesdays in general: 77%
- NYMO and NYAD have now reached levels from where previous market pullbacks started
The best plays were:
catching the continuation move post-FOMC:
L1146.25 T1152
S1153.5 T1149
L1149.5 T1155
Again, it appears prior day. +ve bias and the +ve GLOBEX overnight bias were good clues as to what the market wanted to do.
I missed out on the gap fill play, but as indicated by the arrow, I took a long 1149 on the +ve bias after gap fill. I also took the short 1153 at the top of the FOMC reaction. Unfortunately, my bias prevented me from closing out the short when it broke below 1149 briefly - I had a target of 1146, but it turned out to be a double bottom. I also saw multiple +1K contracts long on almost every tick drop below 1150.5, all the way down to 1148.75. That should have been a huge warning sign for any short. 1151 (~50% retrace) should have been the line in the sand for the short attempt. I wound up exiting breakeven.
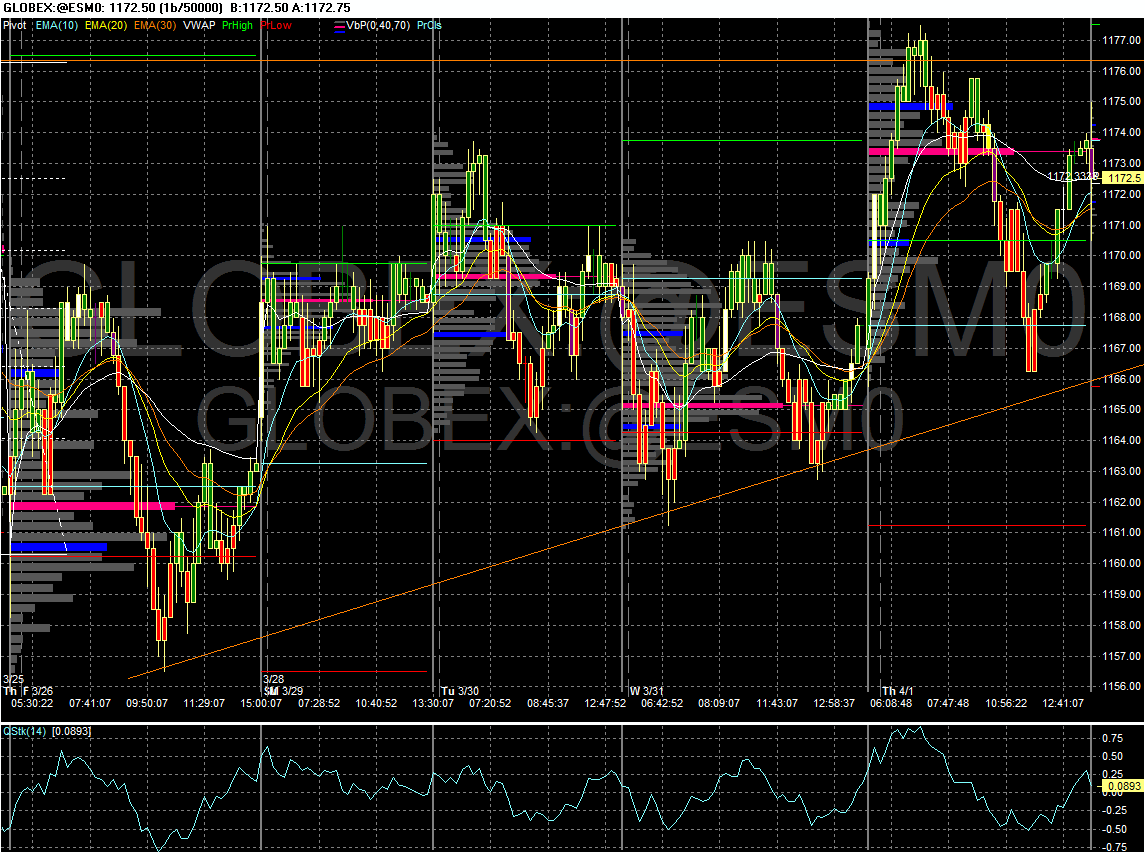
Here is the context leading up to NFP day (Good Friday)
Notes:
- market has been repeating a failed breakout pattern
- all dips have been bought
- 10 20d &50d EMA pointing up.
- uptrend for almost 2 months.
- many sectors starting to show sideways range bound movement.
- For some time now, NYMO & 5d MA of NYAD have been at levels from where previous market pullbacks started.
Based on the past 3 NFP's described here (small sample size duly noted), the biggest move (after the volatility stabilized) was in favour of the session bias the day before. Of course, there was that one NFP at the beginning of Feb/10 which carved out the hammer reversal that started this current uptrend. But even the Feb/10 NFP had a big drop which was inline with the +20pt drop the day before. It is possible we have another trend changing event on Monday.
Bearish scenario:
false breakout above 1178, responsive selling appears in force, then selloff and close below 1158.
Bullish scenario:
False breakdown below 1165, responsive buyers appears in force, causing market to eventually accept 1175 (or higher) as fair value.
Emini Day Trading /
Daily Notes /
Forecast /
Economic Events /
Search /
Terms and Conditions /
Disclaimer /
Books /
Online Books /
Site Map /
Contact /
Privacy Policy /
Links /
About /
Day Trading Forum /
Investment Calculators /
Pivot Point Calculator /
Market Profile Generator /
Fibonacci Calculator /
Mailing List /
Advertise Here /
Articles /
Financial Terms /
Brokers /
Software /
Holidays /
Stock Split Calendar /
Mortgage Calculator /
Donate
Copyright © 2004-2023, MyPivots. All rights reserved.
Copyright © 2004-2023, MyPivots. All rights reserved.


