ES numbers for 3-25-11
These are the zones that I'm working from and the reasons why:
1314 - 1315 - Spike high in current O/N
1310 - R1 and current consolidation in ON
1304.75 - 1306.75 = VA high , RTH high and volume spikes
1301.50 ****** big key area number = closing VWAP, Pivot ( standard),
VPOC before it shifted and volume spikes
1295.75 - 1296.50 = S1, Volume spikes, VPOC before it shifted
1291.25 - 1292.50 = Old Vol spike from Wednesday and Thursdays low
1287.50 = Key volume area from Wednesday*******
Ranges are tight so numbers are a bit close together but will re -adjust in the morning
Good morning. it seems the bullish carried into the early overnight session reaching a high of 1314.00. The expected short term wave one peak could be in. Anything can happen ,of course,but we have reached an extreme overbought condition here and im expecting a stiff decline over the next 2 to three days or so. At least thats my bias now. Sentimentrader seems to agree... here is their 1-5 day outlook:
Click image for original size
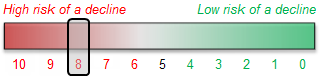
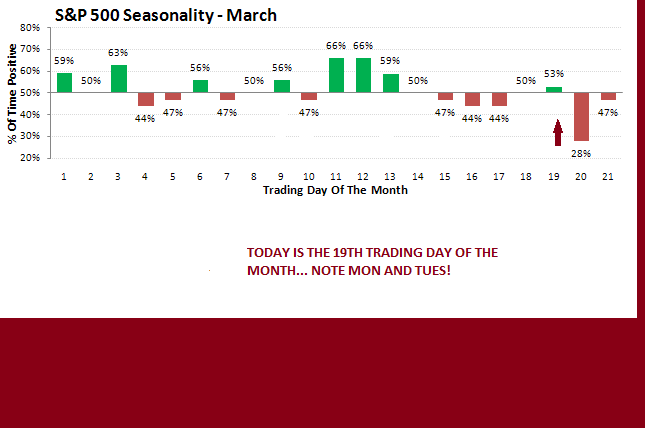
"When the Short-term Indicator Score reached this kind of extreme, the next three days were positive only 43% of the time in the S&P 500." also, be advised that seasonals are getting more negative next week. They also note that"In the history of the S&P SPDR (SPY), the last week in March has been positive only 5 out of 16 years. 4 of the last 5 were negative (last year showed a gain of a whopping +0.1%)."Click image for original size
Perhaps the seasonals will push it up or hold it for one more day...
Click image for original size
...but if they dont heres what the overnight gives us ,so far...Click image for original size
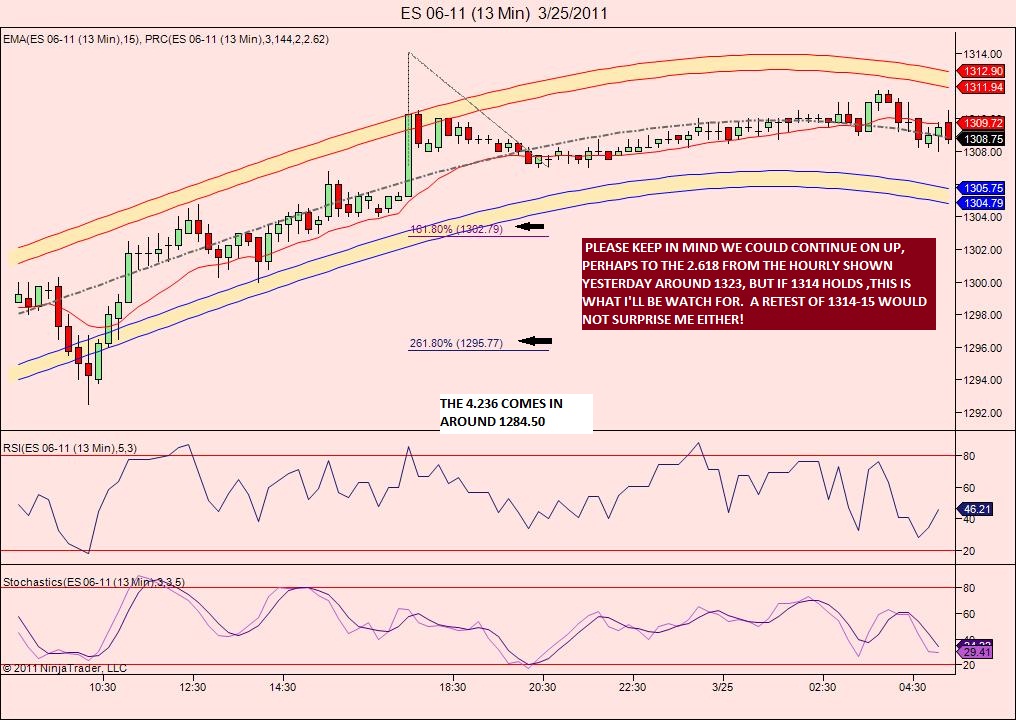
Click image for original size
I agree with the bearish stance... if we look at just the last TWO days of the $tick you can see that the clusters of extremes were lower then Wednesdays at the highs and also had lower - low clusters than Wednesday...a sign of internal weakness....
So I'm taking small shorts at 1309.75......knowing that a report is coming at 8:30.....targeting yesterdays RTH highs at 1306.75
Friday is not the best day for fap fills but we'll see..
Overnight continues to cluster around the R1 level of 1310..
Lots of confluence with the numbers and that is why I typed in more of the reasons......
I wanted to take a quick second to say thanks to all the new posters specifically that have been explaining their ideas/trades. Lots of great postings yesterday that I noticed from new and old posters...
I was too caught up in my technical bubble to comment so I'm doing it now....also loving the footprint trades/ideas too
I was too caught up in my technical bubble to comment so I'm doing it now....also loving the footprint trades/ideas too
Originally posted by BruceMGood morning,friend!..."fap fills"? Does somebody have a 'fat finger' today?...lol .. went to sleep this morning for 1 1/2 hours and had an order to sell at 1312.00. Imagine my frustration when i woke up and saw how long she hung at 11.75 and then headed south!..sheese!
I agree with the bearish stance... if we look at just the last TWO days of the $tick you can see that the clusters of extremes were lower then Wednesdays at the highs and also had lower - low clusters than Wednesday...a sign of internal weakness....
So I'm taking small shorts at 1309.75......knowing that a report is coming at 8:30.....targeting yesterdays RTH highs at 1306.75
Friday is not the best day for fap fills but we'll see..
Overnight continues to cluster around the R1 level of 1310..
Lots of confluence with the numbers and that is why I typed in more of the reasons......
Originally posted by BruceMI sure hope so! I got beat up worse than you! (giving back 9 handles after a plus 12 the day before!...ouch!)... btw, it would seem Mr.Dalton agrees with our negative view...
LOL....I won't fix it....gonna be a better day then yesterday...
fap = gap
Click image for original size

"Currently we believe the long risk is very high as the market has advanced on poor market structure and low volume. If the poor structure is corrected during the day we may adjust the odds. The long overnight inventory along (5:10 AM ET) with two anomalies from yesterday suggest to us that risk is high."
here's my 60 minute chart,show we should get a dip off this median line down to 1302 and 2nd target of 1293 which would be a strong buy in my opinion.
sorry here's the chart
Click image for original size

Thanks for all the posters here and for going to the trouble of annotating and posting charts. I have learned some things I have never looked at.
I will begin posting some charts in the future as well. I have some extensive travel over the next few months, but I'll try and contribute some decent info when I can.
Have a great weekend everyone!
I will begin posting some charts in the future as well. I have some extensive travel over the next few months, but I'll try and contribute some decent info when I can.
Have a great weekend everyone!
Emini Day Trading /
Daily Notes /
Forecast /
Economic Events /
Search /
Terms and Conditions /
Disclaimer /
Books /
Online Books /
Site Map /
Contact /
Privacy Policy /
Links /
About /
Day Trading Forum /
Investment Calculators /
Pivot Point Calculator /
Market Profile Generator /
Fibonacci Calculator /
Mailing List /
Advertise Here /
Articles /
Financial Terms /
Brokers /
Software /
Holidays /
Stock Split Calendar /
Mortgage Calculator /
Donate
Copyright © 2004-2023, MyPivots. All rights reserved.
Copyright © 2004-2023, MyPivots. All rights reserved.