RA
rat89
Rep: 0
Posts: 7,015
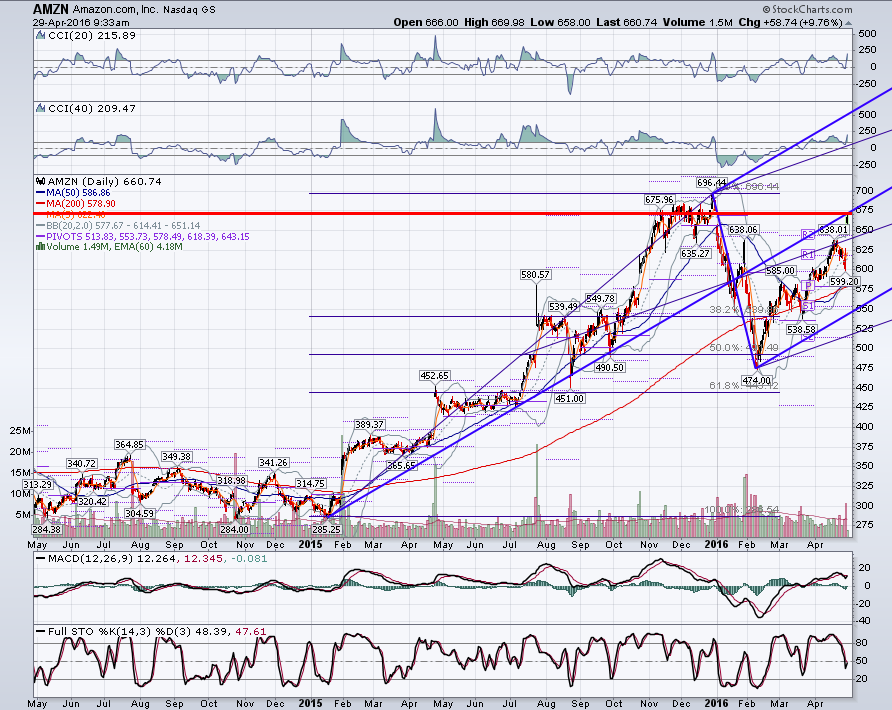
.886 gap traders know the significance of amzn at 671
Click image for original size
JI
jimkane
Rep: 3,058
Posts: 33,089
If this thing sweeps out that big swing-low to the left (at 58.50) there is nothing but air below, and then it may see that upper 30's I have mentioned so many times. I am not posting that as an area/level right now, I'm just looking at a higher timeframe picture and getting that out there once again. I can refine the area if need be later.
JI
jimkane
Rep: 3,058
Posts: 33,089
And that would be interesting.
Originally posted by rat89
.886 gap traders know the significance of amzn at 671
Click image for original size
RA
rat89
Rep: 0
Posts: 7,015
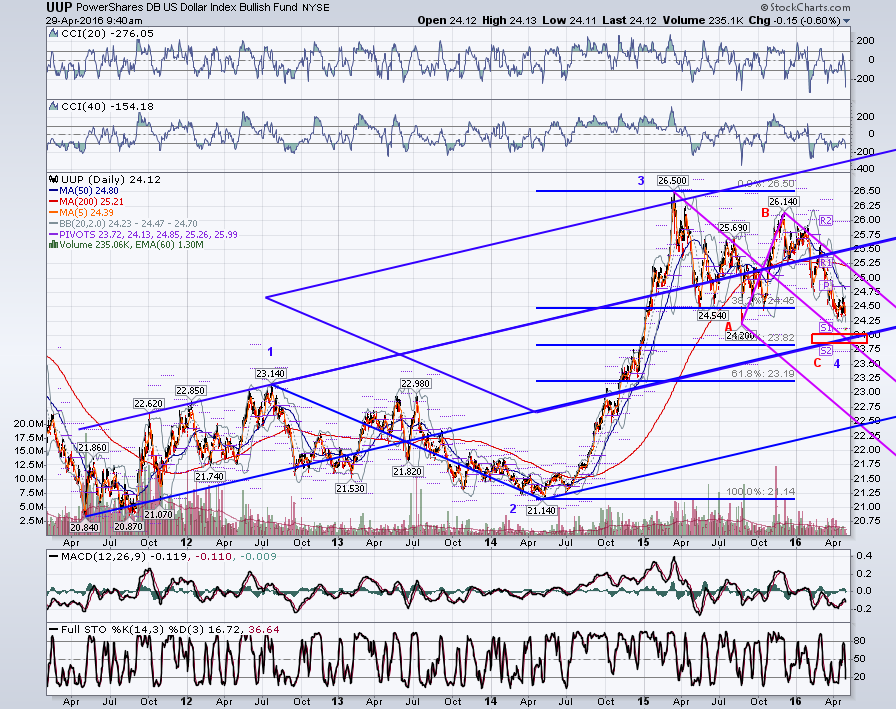
uup daily - perfection for the end of C is in the 23.80 - 24.10 range where C=A at 23.84, 50% rt at 23.82, and x marks the spot
Click image for original size
JI
jimkane
Rep: 3,058
Posts: 33,089
Notice this may be a big bullish ABCD forming. Work up that area, and anything close by you can, to see what you think may be unfolding. Are you bullish for another higher timeframe leg up?
JI
jimkane
Rep: 3,058
Posts: 33,089
I am really hoping the dollar rally starts soon. Dollar up, crude down, market down, rates down, refi time.
Originally posted by rat89
uup daily - perfection for the end of C is in the 23.80 - 24.10 range where C=A at 23.84, 50% rt at 23.82, and x marks the spot
Click image for original size
JI
jimkane
Rep: 3,058
Posts: 33,089
Looking pretty weak.
Originally posted by jimkane
Okay, time to see if these buyers are for real.
RA
rat89
Rep: 0
Posts: 7,015
retail will be very excited to buy, and the pros will likely take it down
Originally posted by jimkane
And that would be interesting.
Originally posted by rat89
.886 gap traders know the significance of amzn at 671
Click image for original size
JI
jimkane
Rep: 3,058
Posts: 33,089
So where is the tightest area for the ABCD? 54-60. Why so wide? It's a very much higher timeframe. And there is a lot of key stuff below that if the ABCD doesn't play out. This thing sold hard, but very well may just be a 'W3' and really get going down. Let's see as it hits this area in here.
JI
jimkane
Rep: 3,058
Posts: 33,089
And here's the new topic. Everyone please go there and vote that up (if you think it is good). Also, I added a post to the above one thread, so make sure even if you voted before you go and vote up that one. I know there are more people reading this than four, so please, everyone, help me out. I need to make sure that they don't seem vulnerable to down voting and we get the positive vibes going. Thanks.
http://www.mypivots.com/board/topic/8616/-1/charts-from-4-29-16
http://www.mypivots.com/board/topic/8616/-1/charts-from-4-29-16