ES Monday 9-19-11
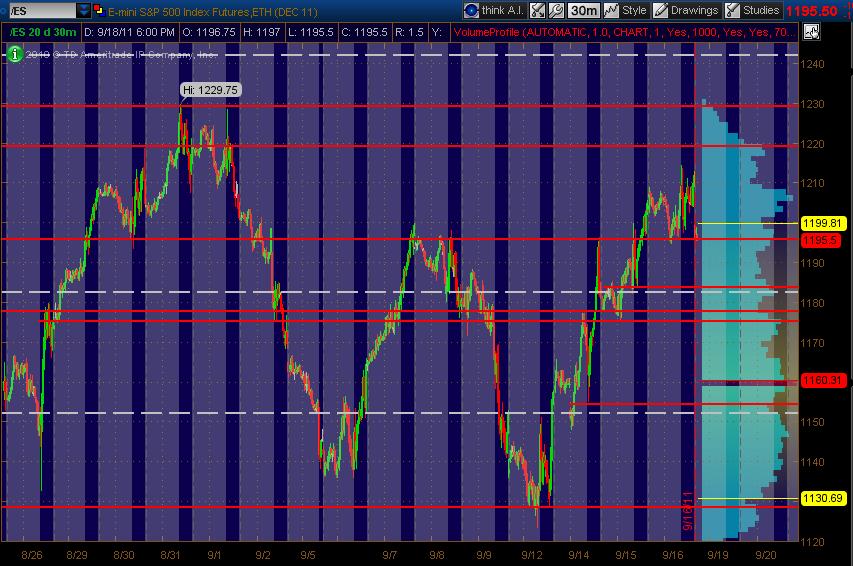
Here's my ES 30min Monkey Map of PASR levels as Red with White dashed lines as Wkly Pivots ... and Volume Profile of the past 20 days on the right vertical axis. The Gray background areas show overnight (non RTH) areas. Have a Fib cluster in and around 1183 as well (though not drawn in). Hope this is helpful.
Click image for original size
"Trust your instincts Son, GO West and don't look back..take the money and run, run Forrest Gump !
Bounce at the I B Close, good for another +1.50 pts..
Change in trend, start looking for Long setup
Above 87, wait for the pullback, you'll likely get it and put the stop@85, the trade is better if it lines up with 1:15 as close as possible..
Bullish Engulfing in the 5min
86 is a good buy and 85.50 is a good stop.. if it can't go below 86 by 1:15, I will likely give this a try
wait for 1:15 and give that stop 1 pt
Double Bottom at IB Close?
Its a no go for me
I may still buy this..
Id go broke trying to read todays posts and trade. In the morning I look for Bruces levels and see how they mesh with mine. Reading any more here will probably cause a brain fart {for me anyway}. A 1.5 stop in 35 pts ranges which we have been having is suicidal in my opinion. You can get an execution and stop at the same time. Best wishes and good trading RB
Emini Day Trading /
Daily Notes /
Forecast /
Economic Events /
Search /
Terms and Conditions /
Disclaimer /
Books /
Online Books /
Site Map /
Contact /
Privacy Policy /
Links /
About /
Day Trading Forum /
Investment Calculators /
Pivot Point Calculator /
Market Profile Generator /
Fibonacci Calculator /
Mailing List /
Advertise Here /
Articles /
Financial Terms /
Brokers /
Software /
Holidays /
Stock Split Calendar /
Mortgage Calculator /
Donate
Copyright © 2004-2023, MyPivots. All rights reserved.
Copyright © 2004-2023, MyPivots. All rights reserved.