Candle Pattern
Click image for original size
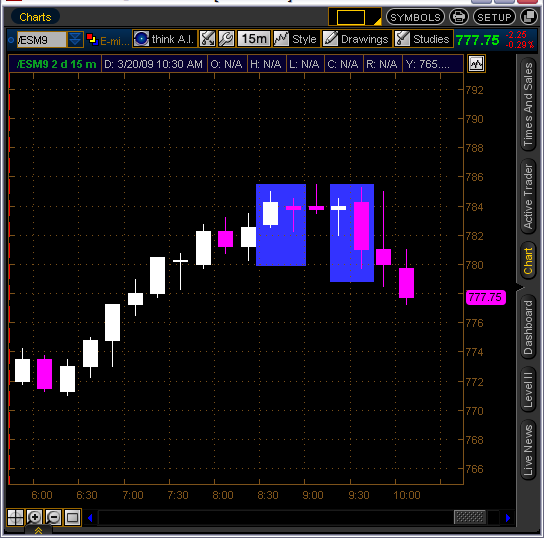
looks like we continue down we're below the FED candle from Wed.
projection 765.50 / 762.50 / 753.50
projection 765.50 / 762.50 / 753.50
got a so9 above my 753.50 / may not make to that proj.
764 = yesterday VAL / 762 area is s2 for options players will hit
maby we go up touch 765 then back down to 757??
got a bullish 15mi. candle / we'll see
touched 765 and backed off / now lets go to 757 at least
that volume spike & shadow @ 61.00 area not a good thing for shorts
766.50 does it for me
one more time down maby 757 this time
I don't trade with MAs ... but recently I started looking at them .. I have set up a quad chart with different time frame of MAs .. Today at 11:30am et. all four MAs came together and in fact price hit them about the same time .. I just got started with this so I'll post what I see from time to time .. looks good so far .. My intent is to use them as a confirming tool not a primary ...
Emini Day Trading /
Daily Notes /
Forecast /
Economic Events /
Search /
Terms and Conditions /
Disclaimer /
Books /
Online Books /
Site Map /
Contact /
Privacy Policy /
Links /
About /
Day Trading Forum /
Investment Calculators /
Pivot Point Calculator /
Market Profile Generator /
Fibonacci Calculator /
Mailing List /
Advertise Here /
Articles /
Financial Terms /
Brokers /
Software /
Holidays /
Stock Split Calendar /
Mortgage Calculator /
Donate
Copyright © 2004-2023, MyPivots. All rights reserved.
Copyright © 2004-2023, MyPivots. All rights reserved.