Candle Pattern
6/9/10 7:40 7:45 est. 5min. bull separating line / low
volume...well see
volume...well see
Click image for original size
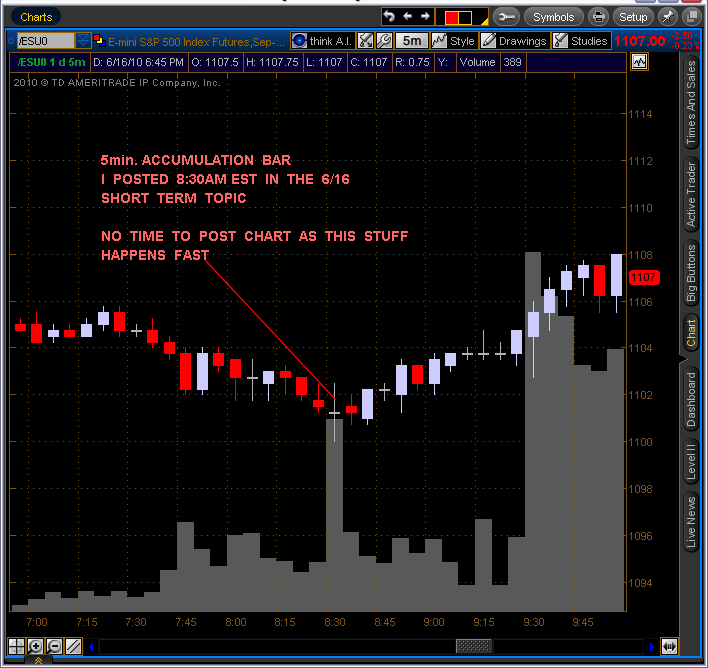
Hey red. Can you explain what makes that an accumulation bar
Originally posted by sjzeno
Hey red. Can you explain what makes that an accumulation bar
=====================================================================
Study Steve Nison for a better understanding of these patterns but
the short answer is (1) the location of the bar (2) volume (3) the stagnant price movement.
heres another accumulation posted earlier:
http://www.mypivots.com/board/topic/4072/26/candle-pattern
I think its the 5th post in that link
http://www.mypivots.com/board/topic/4072/26/candle-pattern
I think its the 5th post in that link
Your welcome sjzeno
sjzeno
"No matter how small a favor someone may do for you, show your appreciation by thanking them."
http://www.mypivots.com/board/Topic/5221/-1/philosophical-ramblings-and-blues-notes#61833
"No matter how small a favor someone may do for you, show your appreciation by thanking them."
http://www.mypivots.com/board/Topic/5221/-1/philosophical-ramblings-and-blues-notes#61833
Study Steve Nison for a better understanding of these patterns but the short answer is (1) the location of the bar (2) volume (3) the stagnant price movement.
First Red thanks for the reply. I'm super late with that! I appreciate you posting the chart.
I'm still trying to understand the accumulation bar.
More or less understand the underlying price action.
The location of the bar is easy to see in both the charts you posted because the trends changed after the bar, but how in real time does this matter. As for volume; does it have to be higher than the surrounding bars or what do you compare volume to? and stagnant price is open and close close to each other.
But an accumulation bar is to show one side buyers or sellers loading up at that price, so do you use it to signal a trend change?
In my reply to you I gave you both the SHORT answer and
also information of how to better understand these candle
patterns
also information of how to better understand these candle
patterns
Just as we have accumulation candle; we also have distribution
candle to give a hint of a top...to understand how to read
these patterns study Steve Nison
The larger the time frame the more likely the move
will be bigger
candle to give a hint of a top...to understand how to read
these patterns study Steve Nison
The larger the time frame the more likely the move
will be bigger
I don't trade with MAs ... but recently I started looking at them .. I have set up a quad chart with different time frame of MAs .. Today at 11:30am et. all four MAs came together and in fact price hit them about the same time .. I just got started with this so I'll post what I see from time to time .. looks good so far .. My intent is to use them as a confirming tool not a primary ...
Emini Day Trading /
Daily Notes /
Forecast /
Economic Events /
Search /
Terms and Conditions /
Disclaimer /
Books /
Online Books /
Site Map /
Contact /
Privacy Policy /
Links /
About /
Day Trading Forum /
Investment Calculators /
Pivot Point Calculator /
Market Profile Generator /
Fibonacci Calculator /
Mailing List /
Advertise Here /
Articles /
Financial Terms /
Brokers /
Software /
Holidays /
Stock Split Calendar /
Mortgage Calculator /
Donate
Copyright © 2004-2023, MyPivots. All rights reserved.
Copyright © 2004-2023, MyPivots. All rights reserved.