Candle Pattern
Originally posted by redsixspeed
To the downside two zones I have are
T1 1069.75/1065.25
T2 1055.75/1050.50
that 1055.75 is @ the flash crash low
I have a third target but T1 & T2 imo are stronger targets
as a day trader I target short range I am aware there are longer
range targets but I'am near sighted in trading..
====================================================================
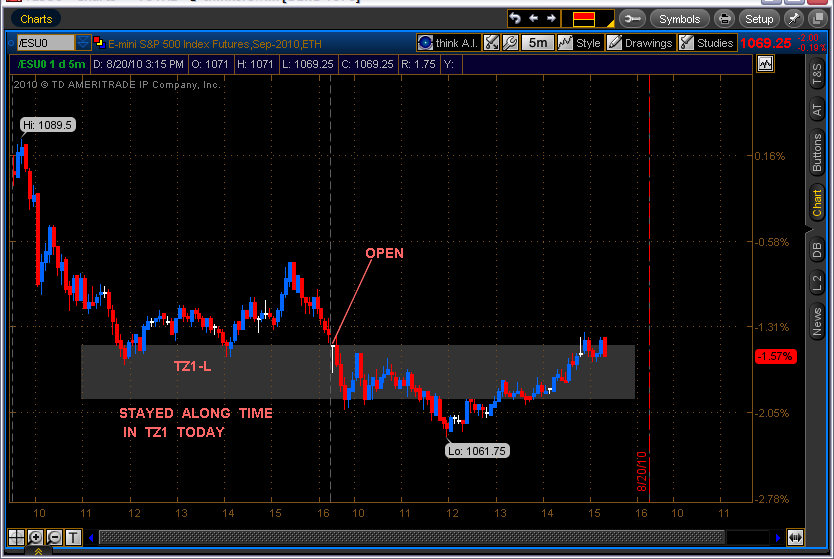
back down to my lower TZ1 & TZ2, after an area has been hit it is weaker so TZ1 may see a bounce
Traded from TZ1 @ bottom to TZ1 @ the top...and back to TZ1 bottom...
pretty cool...gotta break one of these zones..
pretty cool...gotta break one of these zones..
Originally posted by redsixspeed
Traded from TZ1 @ bottom to TZ1 @ the top...and back to TZ1 bottom...
pretty cool...gotta break one of these zones..
======================================================================
I checked my TZ2 to downside and have a correction
1056.25/1050.50
this bottom TZ1 has been tough..they knocked a hole in the bottom
of it when they hit 1063.50...and now they are right back inside
the zone.....somebody get us outta here..
of it when they hit 1063.50...and now they are right back inside
the zone.....somebody get us outta here..
Click image for original size
Click image for original size

bounced out of the mid point of TZ1...dern market likes this zone
Lot of selling @ the cash close...TZ2 may come into play....1060.75 is the mid point of the two zones and it was never hit...the boyz hit it early so that # is still lurking...spx closed @ the mid point of TZ1 if my data is correct, sometimes it ain't the best
Originally posted by redsixspeed
Lot of selling @ the cash close...TZ2 may come into play....1060.75 is the mid point of the two zones and it was never hit...the boyz hit it early so that # is still lurking...spx closed @ the mid point of TZ1 if my data is correct, sometimes it ain't the best
======================================================================
We arrived @ TZ2 @ 3:55a.m.est wonder how long we'll be here
Looks like they go'na make quick work out'a TZ2
TZ3 1040.50 / 1034.00 * 1033.75....after that..
TZ3 1040.50 / 1034.00 * 1033.75....after that..
I don't trade with MAs ... but recently I started looking at them .. I have set up a quad chart with different time frame of MAs .. Today at 11:30am et. all four MAs came together and in fact price hit them about the same time .. I just got started with this so I'll post what I see from time to time .. looks good so far .. My intent is to use them as a confirming tool not a primary ...
Emini Day Trading /
Daily Notes /
Forecast /
Economic Events /
Search /
Terms and Conditions /
Disclaimer /
Books /
Online Books /
Site Map /
Contact /
Privacy Policy /
Links /
About /
Day Trading Forum /
Investment Calculators /
Pivot Point Calculator /
Market Profile Generator /
Fibonacci Calculator /
Mailing List /
Advertise Here /
Articles /
Financial Terms /
Brokers /
Software /
Holidays /
Stock Split Calendar /
Mortgage Calculator /
Donate
Copyright © 2004-2023, MyPivots. All rights reserved.
Copyright © 2004-2023, MyPivots. All rights reserved.