Candle Pattern
For some reason the above chart doesn't add up with my short term chart
Looking @ the wrong time rth vs. 24hr. data.
Click image for original size
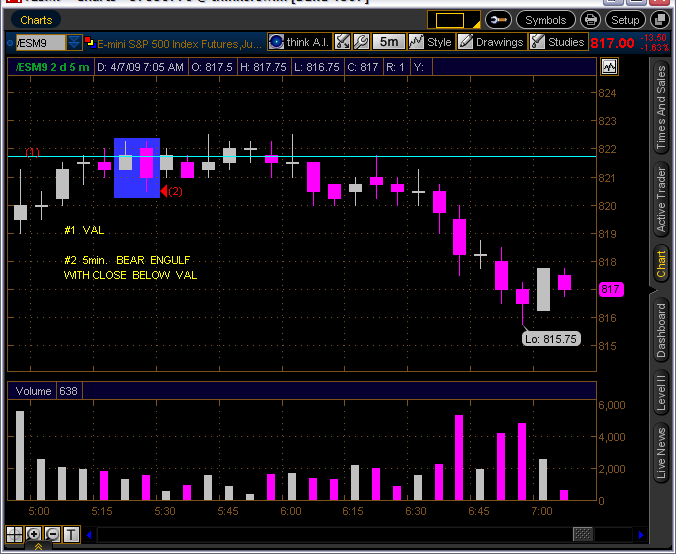
A prime use of the engulfing pattern is utilizing them as support or resisrance.
The high yesterday was 822.25 in that area we had the 5min. engulf shown in the
chart above. This pattern confirmed the selling pressure in that area. I use
candle patterns to help confirm an area I already belive to be an s/r.
The pattern is stronger if the first candle trades thru and close above/below
then the second candle trades thru and close above/below.
This applies to any time frame 60/30/15/5/ ect.
above.
Click image for original size
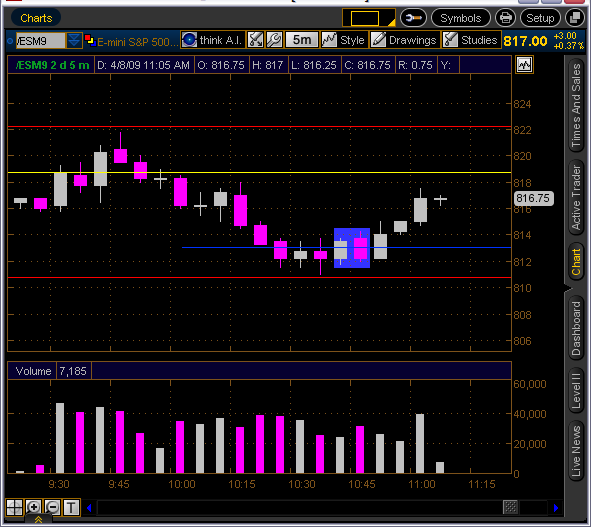
The blue line is so9 813.00. We have a bear pattern so why did
the market reverse? This pattern is called a "Last Engulf".
After a down trend we get a bear engulf on good volume as
this one is; the pattern can be a bottom reversal.
redsixspeed: which minute chart do we use for consistency. 5 min/15 min or something else.
I use 30/15/5 min. Watch the volume spike (I use 5min. mostly for the spike) it will
spike before the signal most times. The 5min. signal is what I look for mostly. I guess
I may miss a trade by not watching the 30/15min. enough. To see the signal takes alot of focus
so if folks are watching other markets this may not work well for them.
spike before the signal most times. The 5min. signal is what I look for mostly. I guess
I may miss a trade by not watching the 30/15min. enough. To see the signal takes alot of focus
so if folks are watching other markets this may not work well for them.
In the chart above I knew 813 may be a good support. I then watch for my signal
to confirm. To help with consistency I look for a signal after a 10# up/down
and any other area that I belive is a s/r. Some may see something I don't and
I miss.
to confirm. To help with consistency I look for a signal after a 10# up/down
and any other area that I belive is a s/r. Some may see something I don't and
I miss.
Hi redsixspeed,
what do you mean by: " To help with consistency I look for a signal after a 10# up/down" ?
Do you look for signals after a 10 point move in the ES from important pivot points ?
Nice journal btw. !
what do you mean by: " To help with consistency I look for a signal after a 10# up/down" ?
Do you look for signals after a 10 point move in the ES from important pivot points ?
Nice journal btw. !
Consistency is the wrong word (sorry for that). That makes it sound as if we would see the same pattern
over and over. In an earlier post I said "once you learn the beat of the market movement you will see
more candle patterns". Nison talked about an 8 to 10 movement and I watch any area that is a 10#
highs/lows and points. The reason I have posted so many engulf patterns??? It just seems to be the
pattern I have seen the most of lately. There are others that work as well.
I don't trade with MAs ... but recently I started looking at them .. I have set up a quad chart with different time frame of MAs .. Today at 11:30am et. all four MAs came together and in fact price hit them about the same time .. I just got started with this so I'll post what I see from time to time .. looks good so far .. My intent is to use them as a confirming tool not a primary ...
Emini Day Trading /
Daily Notes /
Forecast /
Economic Events /
Search /
Terms and Conditions /
Disclaimer /
Books /
Online Books /
Site Map /
Contact /
Privacy Policy /
Links /
About /
Day Trading Forum /
Investment Calculators /
Pivot Point Calculator /
Market Profile Generator /
Fibonacci Calculator /
Mailing List /
Advertise Here /
Articles /
Financial Terms /
Brokers /
Software /
Holidays /
Stock Split Calendar /
Mortgage Calculator /
Donate
Copyright © 2004-2023, MyPivots. All rights reserved.
Copyright © 2004-2023, MyPivots. All rights reserved.