Candle Pattern
market still moving back up...looking for 1204.00 area
Click image for original size
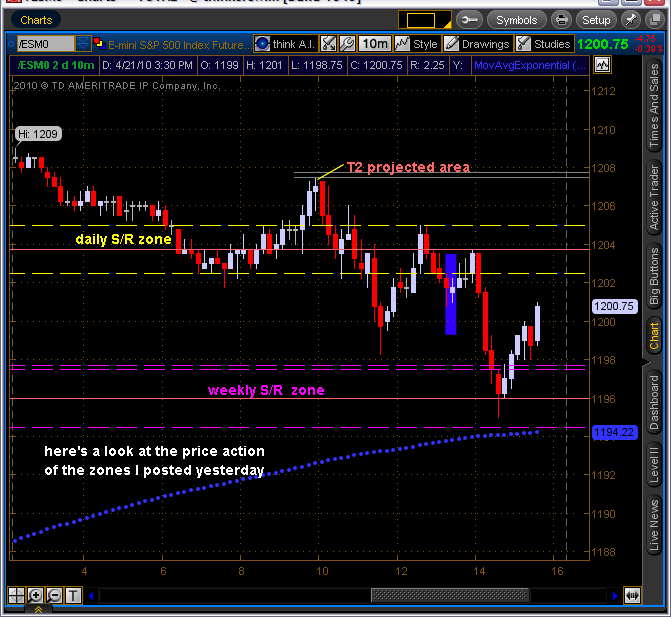
In the previous charts we traded up thru the weekly S/R zone = bullish
at the sametime we traded down thru the daily S/R zone = bearish
at the sametime we traded down thru the daily S/R zone = bearish
Keep in mind, when we are in an oversold/overbought condition
the candle signals take on more weight
the candle signals take on more weight
Originally posted by redsixspeed
I cal. longer term fib areas using four different sets of #s.
Those #s gave the following 50% fib retrace #s:
1126.25 / 1125.25 / 1121.37 / 1119.00
1119.00 is the boss imo.
=====================================================================
The more things change, the more they stay the same..
HAPPY MOTHERS DAY...
nice red.
As long as 1126.25 holds we are going to 1223/1232/1240/1270 and 1320.
The downdraft was too much and the "fat finger" bs was a hollywood script.
NO bear mkt has started with the action we got and I do not forsee one. The retail investor has not gotten in...too scared and now the high should be much past 1270.
The pattern is reminescent of Feb 27, 2007 and May 19 will give us an indication.
For May 9/10 overnight and day 1152.50 and 1156.50 are first targets once 1136 is blown by. At the low is 1121.00 if it gets there.
The Moolah(Measured)Move target is 1212.50 but first 1172.75.
May 12 is the next micro turning date.
G.T.
The mean of that big 15min. open candle in SPX may act
as support if we go that way....fwiw
as support if we go that way....fwiw
Measured Move is a powerful tool.
pg. 249 "Japanese CandlStick Charting Techniques"
pg. 249 "Japanese CandlStick Charting Techniques"
Originally posted by redsixspeed
Measured Move is a powerful tool.
pg. 249 "Japanese CandlStick Charting Techniques"
What is a measured move?
Measured Move:
===================================== 1155.00
===================================== 1150.00
Identify a box range, if the market breaks above/below,
rule says it should go at least the same distance as
the box. In the ex. above a break up = T1 1160.00
break below = T1 1145.00
===================================== 1155.00
===================================== 1150.00
Identify a box range, if the market breaks above/below,
rule says it should go at least the same distance as
the box. In the ex. above a break up = T1 1160.00
break below = T1 1145.00
I don't trade with MAs ... but recently I started looking at them .. I have set up a quad chart with different time frame of MAs .. Today at 11:30am et. all four MAs came together and in fact price hit them about the same time .. I just got started with this so I'll post what I see from time to time .. looks good so far .. My intent is to use them as a confirming tool not a primary ...
Emini Day Trading /
Daily Notes /
Forecast /
Economic Events /
Search /
Terms and Conditions /
Disclaimer /
Books /
Online Books /
Site Map /
Contact /
Privacy Policy /
Links /
About /
Day Trading Forum /
Investment Calculators /
Pivot Point Calculator /
Market Profile Generator /
Fibonacci Calculator /
Mailing List /
Advertise Here /
Articles /
Financial Terms /
Brokers /
Software /
Holidays /
Stock Split Calendar /
Mortgage Calculator /
Donate
Copyright © 2004-2023, MyPivots. All rights reserved.
Copyright © 2004-2023, MyPivots. All rights reserved.