Candle Pattern
The 873.00 projection from above post^^ acting as resistance @ this point
the change of polarity principle
the change of polarity principle
I really appreciate you sharing your projections, Red. That's neat stuff. If you throw up angle pivots hitting the 30s and divisions or multiples of them (30, 45, 90) you could monitor from a distance how your sup/res are in relation to weakness or strength compared to the entire swing.
That's how I knew there was trouble in the low 70s. The new monthly R1 pivot at 911.67 might help it along on the next expansion cycle.
Tangentially, 90 degrees, a full swing, from 665.75 is 931.50. We're not officially in a bull until we hold a corner from there and trade above it.
That's how I knew there was trouble in the low 70s. The new monthly R1 pivot at 911.67 might help it along on the next expansion cycle.
Tangentially, 90 degrees, a full swing, from 665.75 is 931.50. We're not officially in a bull until we hold a corner from there and trade above it.
I know what your saying SPQR. The problem I have is if I look to far out say to the
911 or 931 area you mentioned I get tunnel vision and watch that area more than
other areas closer. Someone posted the 900 area a week or two ago. That was too far
out for me. The only projection I have had close to that is 889.50. We may go to that
900 but I'am more interested in how we get there.....You know up down up down / I'll
capture those moves as we move toward areas further out...I'am sure I don't hold
a position as long as most...Thats just me and I know me... :)
I'm just saying...
The thing about the angle projections is if one put up a resistance fib or gann grid opposite from bias you can have profiling information of recent and immediate future action.
It's a lot of math though. So.. You're alright, Red..
The thing about the angle projections is if one put up a resistance fib or gann grid opposite from bias you can have profiling information of recent and immediate future action.
It's a lot of math though. So.. You're alright, Red..
Click image for original size
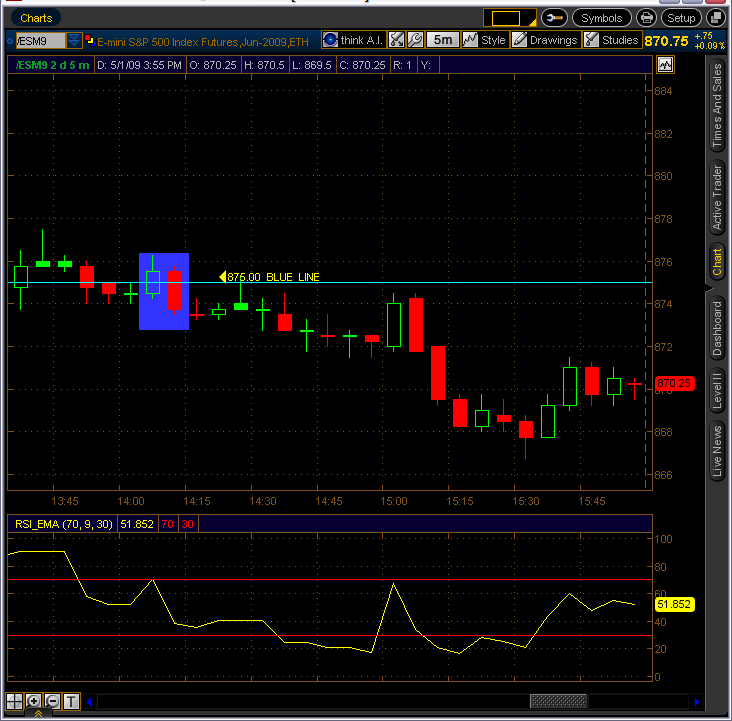
We got our signal @ that important 875
area, also you see bullish trend candles
which proved going into the close. I heard
a trader say 900 or better next week depending
on the news.
I'm going to divy up the ranges in a 2 bar NR ORB and NR7 to go with that inside range close and see if we can't stay on the right side of this next one. I'll post my findings in a different thread, Red, if you'ld prefer.
np; SPQR
These bars^^^are 5min. so a close look @ the 5:20 & 5:25 bars show what some call "inside bar"
I call "harami" and is the reversal to move back up. If I were to post all the reversal patterns
that appear during the day thats all I would get done...lol...I had the reversal this morning
@ the overnite high @ 875 then reversal @ the 862/864 area then the one I posted here @ the same
875 and again @ the one I just talked about @ the harami...To see these takes alot of focus.
By all means SPQR and anyone else who looks for candle patterns please post them here
I just noticed something in the chart above and is an important part of using candles,
look at the last two candles on right side of the chart:
They form a bear harami, however they are at the start of the move up, knowing my projection
and what I belive to be a resistance area this pattern carries less or sometimes no weight
because of where and when it appeared. This is where the trader makes a decision to stay
with the trade or not.
Click image for original size
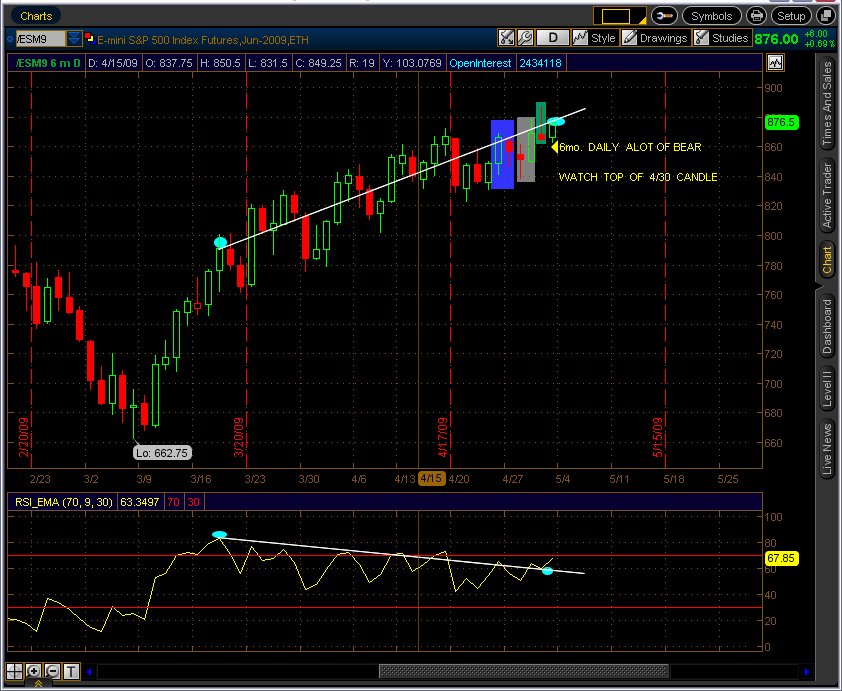
Snap a line on the 3:55pm edt (today) ES 5min candle @ the mean / you will
see how this area acted as support until a short time ago
see how this area acted as support until a short time ago
I don't trade with MAs ... but recently I started looking at them .. I have set up a quad chart with different time frame of MAs .. Today at 11:30am et. all four MAs came together and in fact price hit them about the same time .. I just got started with this so I'll post what I see from time to time .. looks good so far .. My intent is to use them as a confirming tool not a primary ...
Emini Day Trading /
Daily Notes /
Forecast /
Economic Events /
Search /
Terms and Conditions /
Disclaimer /
Books /
Online Books /
Site Map /
Contact /
Privacy Policy /
Links /
About /
Day Trading Forum /
Investment Calculators /
Pivot Point Calculator /
Market Profile Generator /
Fibonacci Calculator /
Mailing List /
Advertise Here /
Articles /
Financial Terms /
Brokers /
Software /
Holidays /
Stock Split Calendar /
Mortgage Calculator /
Donate
Copyright © 2004-2023, MyPivots. All rights reserved.
Copyright © 2004-2023, MyPivots. All rights reserved.