Candle Pattern
The mean of the red candle in above chart is 922.75 / at the 8:30am edt news
this morning the market went to 922.50 and turned
this morning the market went to 922.50 and turned
This mean works well on the 30min when there is a nice thrust and price doesn't return for a few bars like the mean on the 11:30 bar Friday morning was the low 11:30 last night. I know of a trader, can't think of his name right now, he was a big Italian floor trader He used the mean, called it something pivots. I'll look it up. That and order flow was all he said he used on the floor.
Rules were best I can remember....To buy the market it must be above yesterdays mean AND above the close.
Rules were best I can remember....To buy the market it must be above yesterdays mean AND above the close.
I use the mean and the candle pattern to confirm an area I think is a s/r
ie... with the candle in the last chart (above) I had projection to 922.50
and the mean of the candle was 922.75... A short time frame candle 5/15/30/min.
with good volume is a good area to watch during the day
ie... with the candle in the last chart (above) I had projection to 922.50
and the mean of the candle was 922.75... A short time frame candle 5/15/30/min.
with good volume is a good area to watch during the day
Just thinking out loud
Click image for original size
Did that 2pm news help make that move back up?...
quote:
Originally posted by CharterJoe
This mean works well on the 30min when there is a nice thrust and price doesn't return for a few bars like the mean on the 11:30 bar Friday morning was the low 11:30 last night. I know of a trader, can't think of his name right now, he was a big Italian floor trader He used the mean, called it something pivots. I'll look it up. That and order flow was all he said he used on the floor.
Rules were best I can remember....To buy the market it must be above yesterdays mean AND above the close.
See if you can get him to share some of his secrets
The mean of todays 8:30am esdt candle will be an area of resistance
if there is a move back up
if there is a move back up
Click image for original size

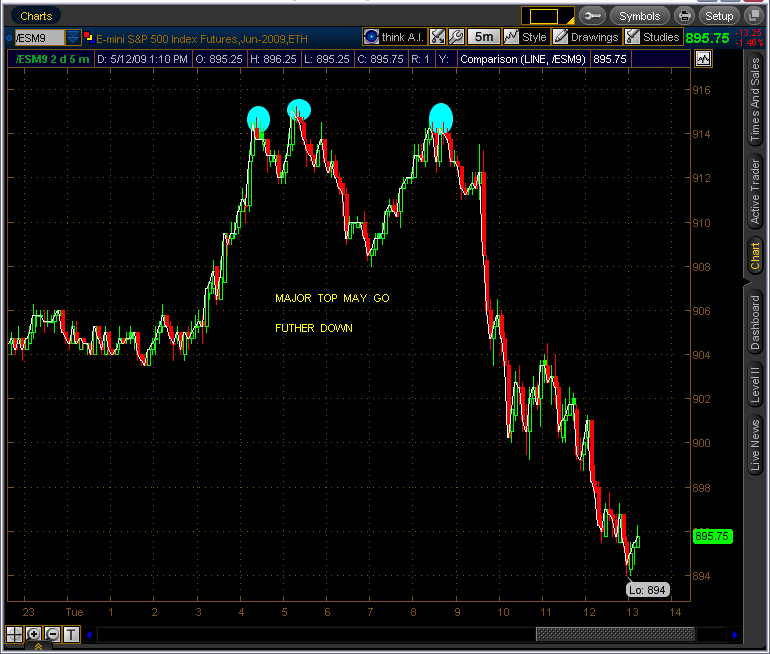
Were moving up to the 914/915 area where this move down started on 5/12. This has been hit
three times, fourth time we go thru ?
three times, fourth time we go thru ?
Sometimes I save a chart and study it by turning it up-side down. I noticed another
trader has added a tool in his chart package that will do this with live charts...fwiw
trader has added a tool in his chart package that will do this with live charts...fwiw
I don't trade with MAs ... but recently I started looking at them .. I have set up a quad chart with different time frame of MAs .. Today at 11:30am et. all four MAs came together and in fact price hit them about the same time .. I just got started with this so I'll post what I see from time to time .. looks good so far .. My intent is to use them as a confirming tool not a primary ...
Emini Day Trading /
Daily Notes /
Forecast /
Economic Events /
Search /
Terms and Conditions /
Disclaimer /
Books /
Online Books /
Site Map /
Contact /
Privacy Policy /
Links /
About /
Day Trading Forum /
Investment Calculators /
Pivot Point Calculator /
Market Profile Generator /
Fibonacci Calculator /
Mailing List /
Advertise Here /
Articles /
Financial Terms /
Brokers /
Software /
Holidays /
Stock Split Calendar /
Mortgage Calculator /
Donate
Copyright © 2004-2023, MyPivots. All rights reserved.
Copyright © 2004-2023, MyPivots. All rights reserved.