Well, jarek, sometimes you see non-stop moves without corrections, especially when it is caused by MRRD's, and I just try to stay with them. This did have a nice little 'W2' once it started, and that TD on the way up, so I see it as having some health. It also has lots of smaller dips. It may need more after it gets to the 1.272+ area, which it is very close to now, but the mania is just spreading, so I rather suspect it wants 80 today in a straight shot.
JA
jarek
Rep: 94
Posts: 3,474
0
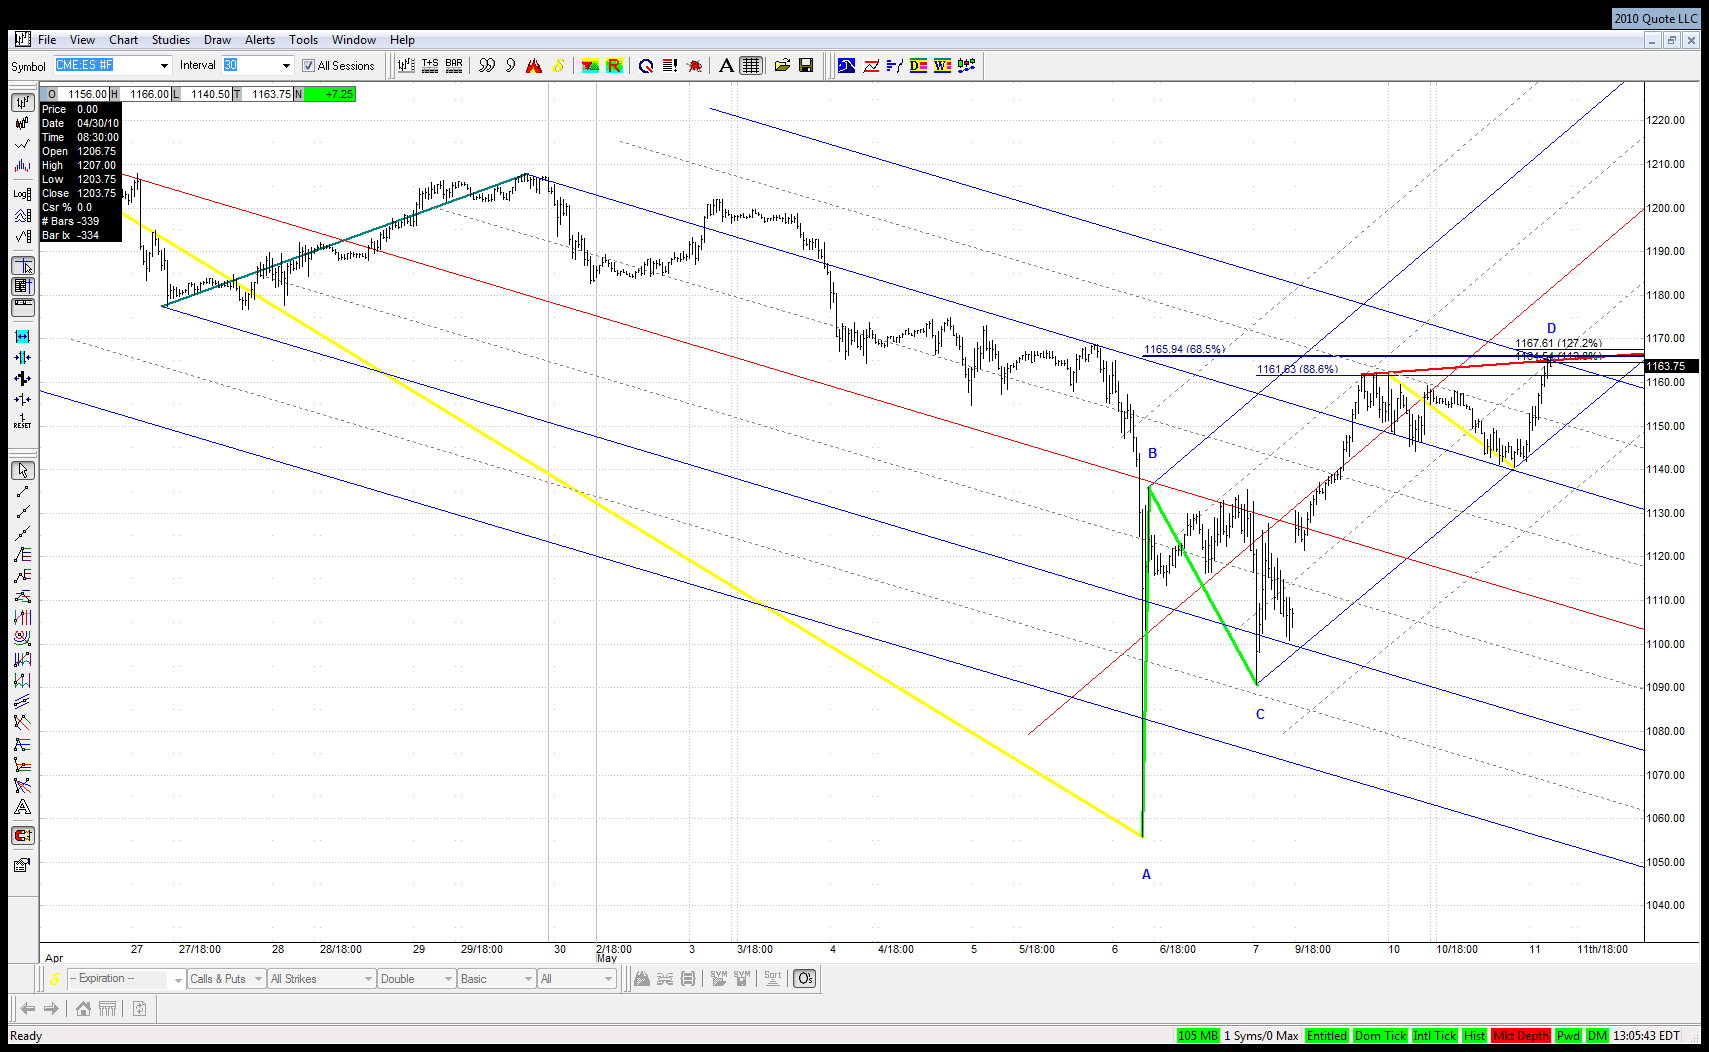
But as for know it was stopped exactly in the area on my chart and at .685 of the whole move down which was hit to the tick
JA
jarek
Rep: 94
Posts: 3,474
0
I could also think of the following ABCD, where CD leg is very close to being equal with AB leg despite lasting probably 100 times longer. It hit .685 retracement of the whole leg down to the tick:
Click image for original size
JA
jarek
Rep: 94
Posts: 3,474
0
This CD leg displays also almost textbook Elliott 5 waves structure
JI
jimkane
Rep: 3,058
Posts: 33,089
1
That's the 5 waves I referred to. It really warns me to be wary of this area. But 7 waves is the most common in my experience, so another push up and over this to the 80 area may be in the offing. We'll see. It sure 'sees' this area here.
JI
jimkane
Rep: 3,058
Posts: 33,089
0
I think they are ready for another leg up, no correction.
JI
jimkane
Rep: 3,058
Posts: 33,089
0
And there's the new HOD. 43.74-44 trigger, now 66.50. Not too bad.
ER
EricD
Rep: 63
Posts: 692
0
what a stop run burst....i dont see it stoping until my layers above..
JI
jimkane
Rep: 3,058
Posts: 33,089
1
Boink! as your area is fully cleared. Now 69. We should see 80 today no problem. Imagine that. If we see 80 we will be up 72.50 points in a day and a half (Sunday night to Tuesday late AM). I'd call that strong follow through.