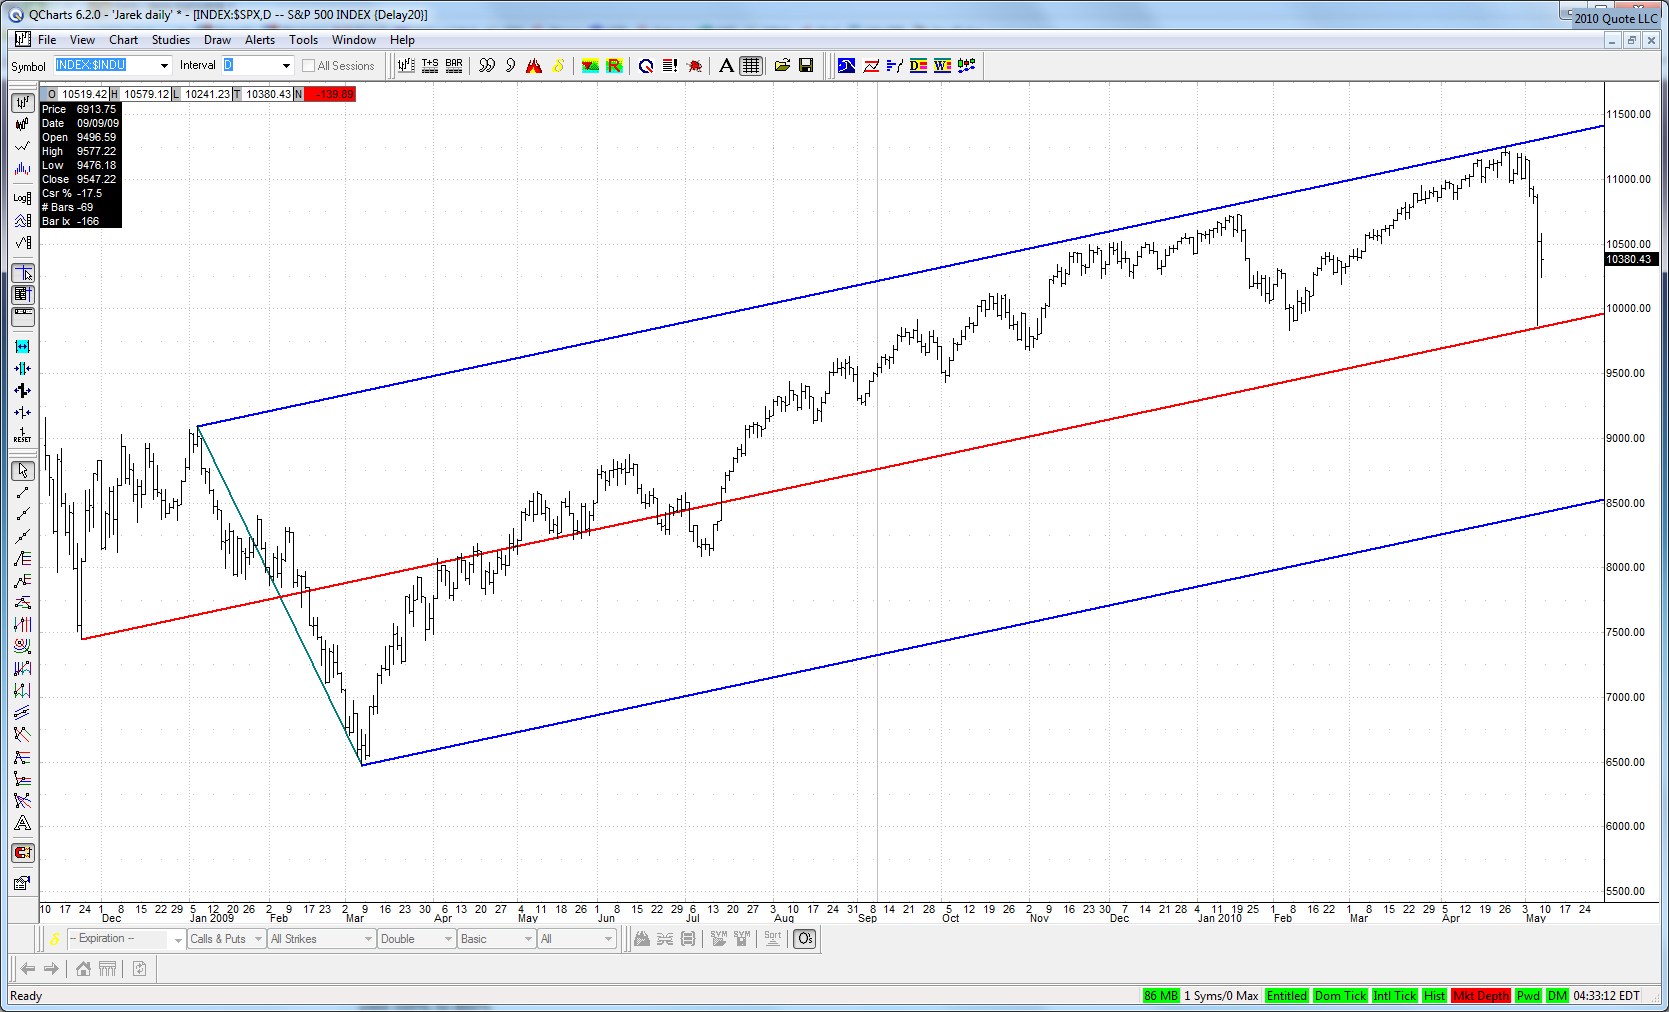
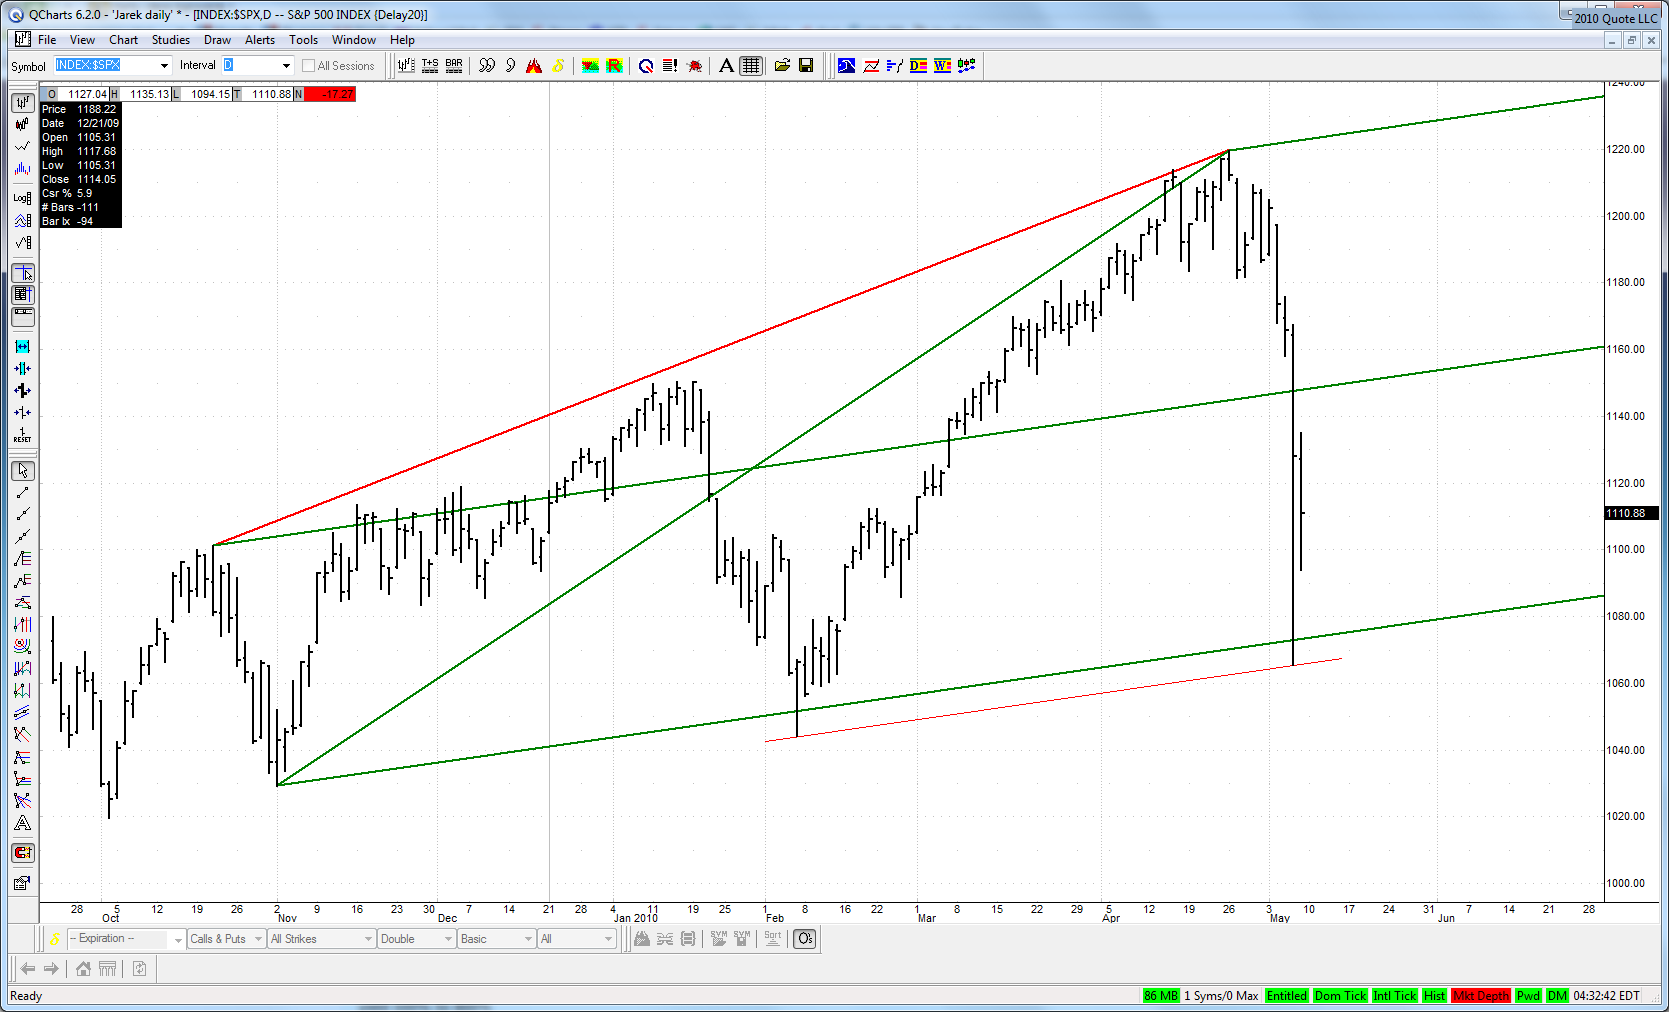
Let's see if another 'flash crash' happens... Then they can bust all the trades again as everyone covers at the low...
ER
EricD
Rep: 63
Posts: 692
0
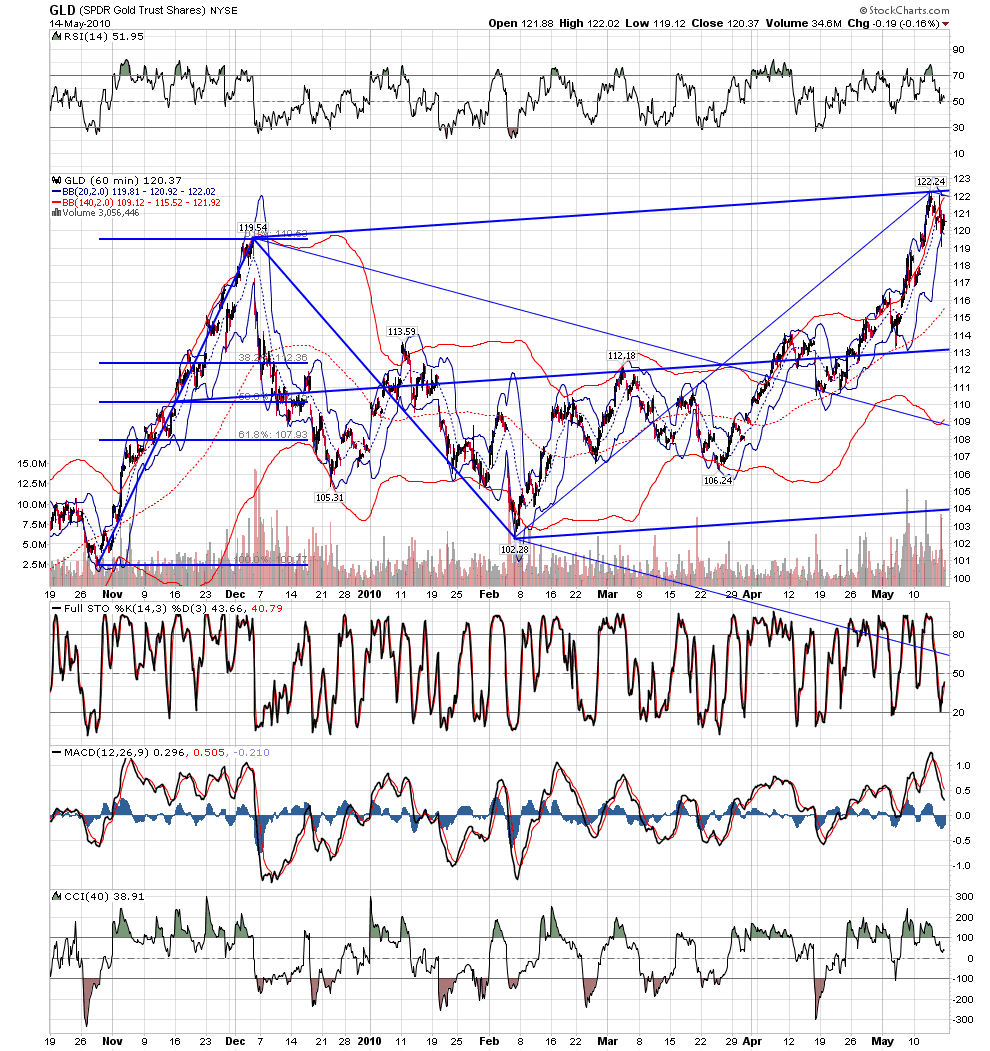
sorry Jim..I still dont know how you focus on them all and comment. Gold...beautiful DT abcd with a wonderful trigger basis 60 min.crdue another great setup say 10:15et on basis of a 5 min chart... management mode across the board.
JI
jimkane
Rep: 3,058
Posts: 33,089
0
(Edited )
That's why I've hardly posted today. The DT in gold with spectacular trigger was awesome, glad you saw it. Crude, what can I say? Amazing day.
JI
jimkane
Rep: 3,058
Posts: 33,089
0
ES selling now done, up it goes. 15 points? 20?
JI
jimkane
Rep: 3,058
Posts: 33,089
0
Am I serious? Watch 31 and 33 and see what it does. I think it will want like 57-60, and then down. But if the big sellers are here to stay, 31 or 33 could send it down for another wave, and I have 16 calling this like a siren on the rocks. So, let's see what it does.
ER
EricD
Rep: 63
Posts: 692
0
yes 16 is screeming ..I have a multiple lines at 22-20 but waiting to see how it plays out.
JI
jimkane
Rep: 3,058
Posts: 33,089
0
31 area hit, reaction back to trend continuation area, and now up to take a shot at 33 area. Then we see. Staying long side bias for now, very short-term intraday, that is.
JI
jimkane
Rep: 3,058
Posts: 33,089
0
33 area hit (within 2 ticks, it's an area, not an exact point), but what it does right here after this checkback, at this spot, will tell the tale.
JI
jimkane
Rep: 3,058
Posts: 33,089
0
And right up off that spot, as mentioned. Very clear action, eh?
ER
EricD
Rep: 63
Posts: 692
0
yes very interesting ...does it retest that key line and then roll? or burst up to 37?