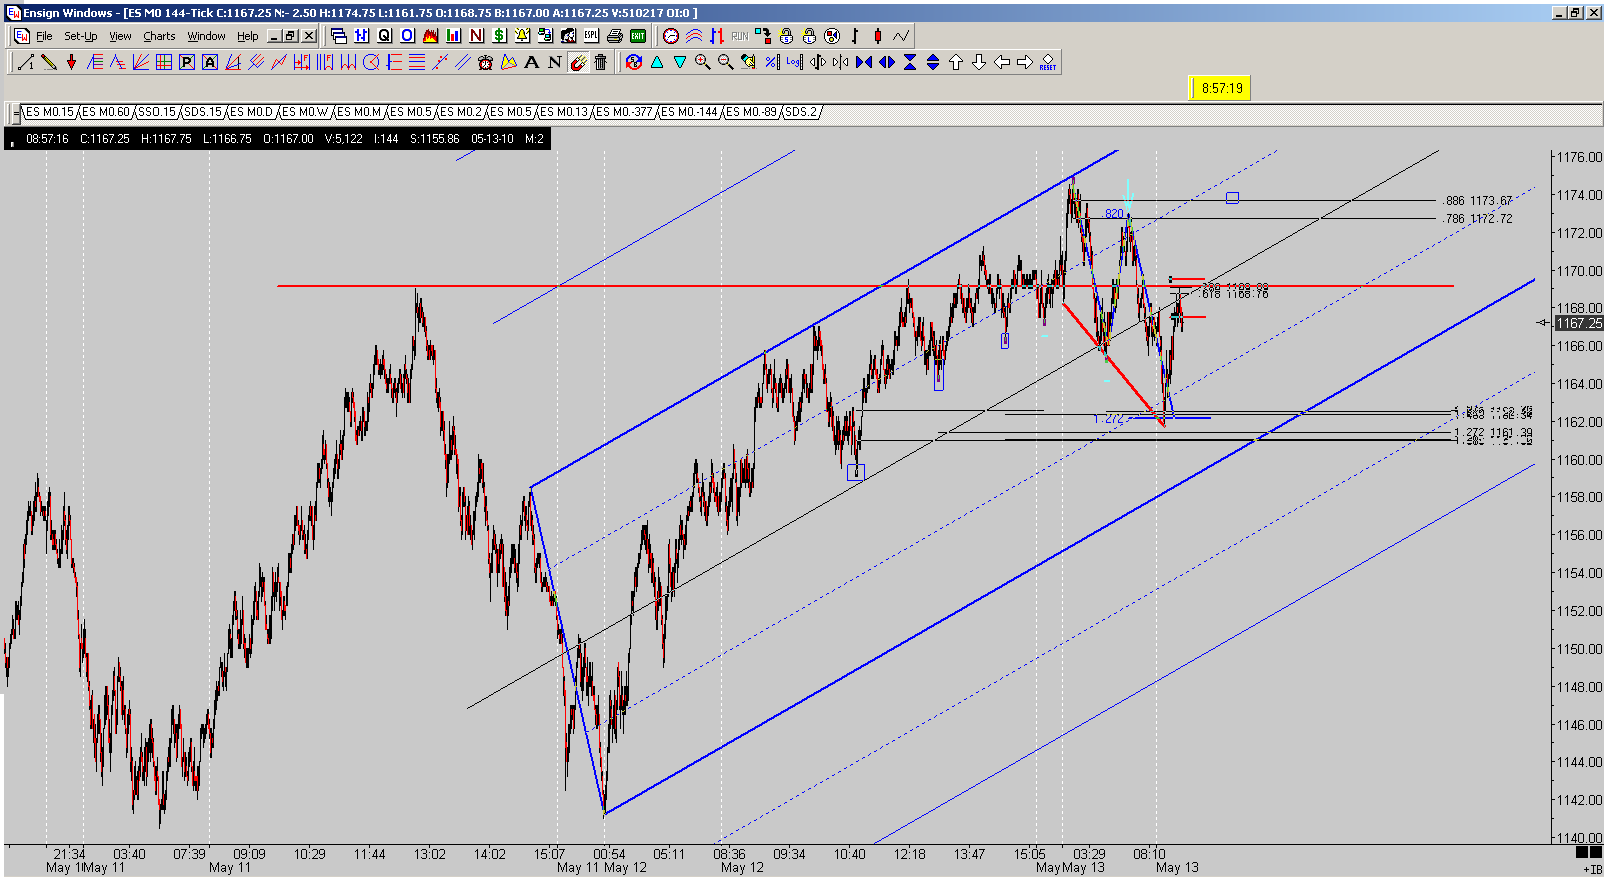
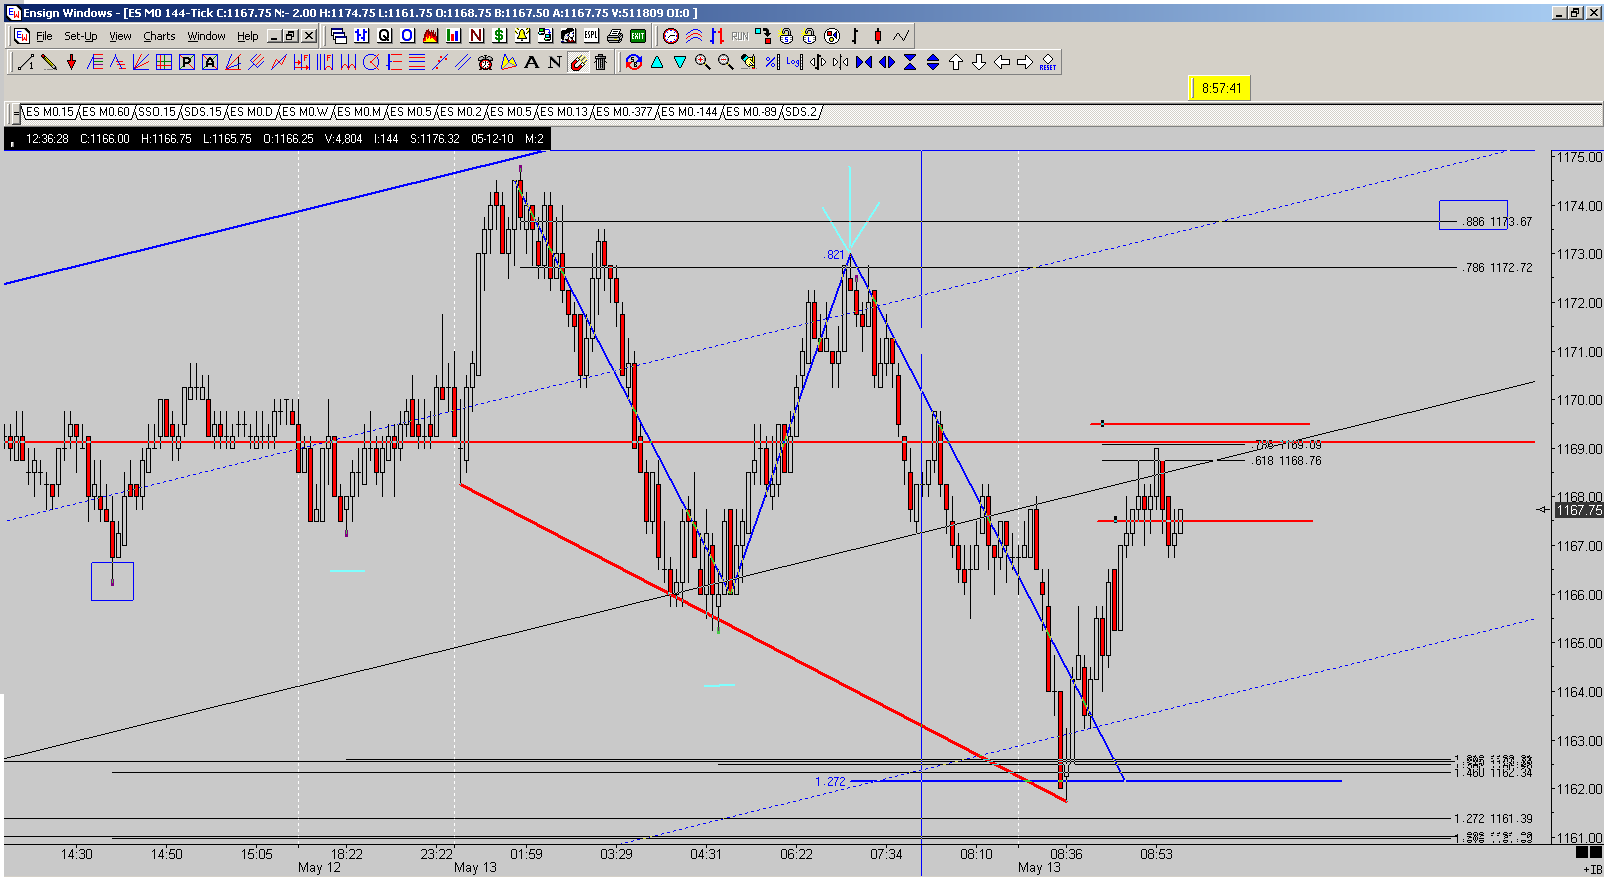
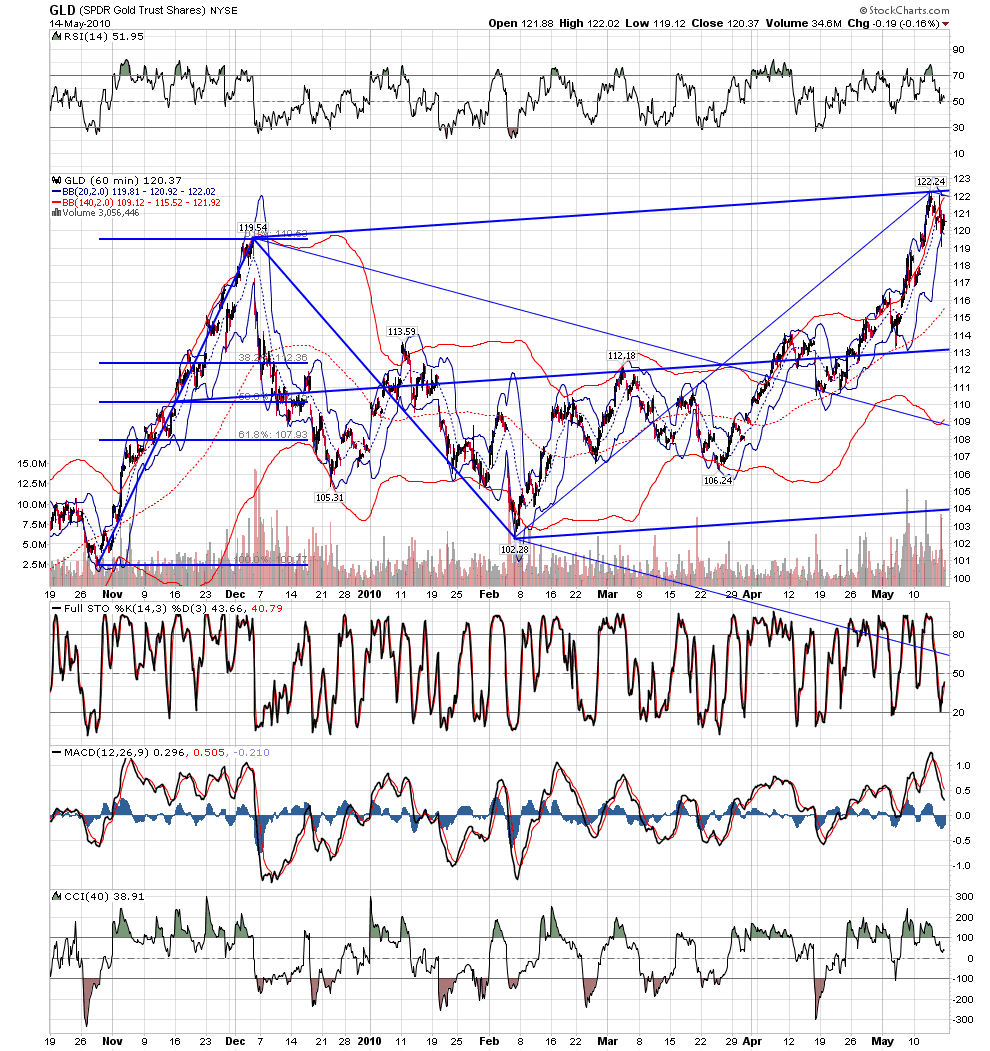
ABCD in here, at .382 and key line. But are they ready to buy in here???
JI
jimkane
Rep: 3,058
Posts: 33,089
0
Key line here to see if they really plan to run off this sweet ABCD.
AL
albert
Rep: 99
Posts: 3,094
1
Charts
Al Kamego
Click image for original size
Click image for original size
JI
jimkane
Rep: 3,058
Posts: 33,089
0
Wow, they came off that little pullback ABCD there like a shot!
JI
jimkane
Rep: 3,058
Posts: 33,089
1
3D to a 'test' there and local top? I'd love to see this nice, big sweet bullish ABCD fail. You know what that would imply...
JI
jimkane
Rep: 3,058
Posts: 33,089
0
You all notice how the reaction off this spectacular-looking ABCD was all chop and grind, and not impulsive?
AL
albert
Rep: 99
Posts: 3,094
0
Jim,
Could the "chop & grind" also be called "overlap?"
TIA.
Al Kamego
JI
jimkane
Rep: 3,058
Posts: 33,089
1
Al, in this case, yes. Very corrective looking, not what one would expect off such a clean pattern setup. It was expected by me, though, as can be inferred from the three ??? I put in the original post.