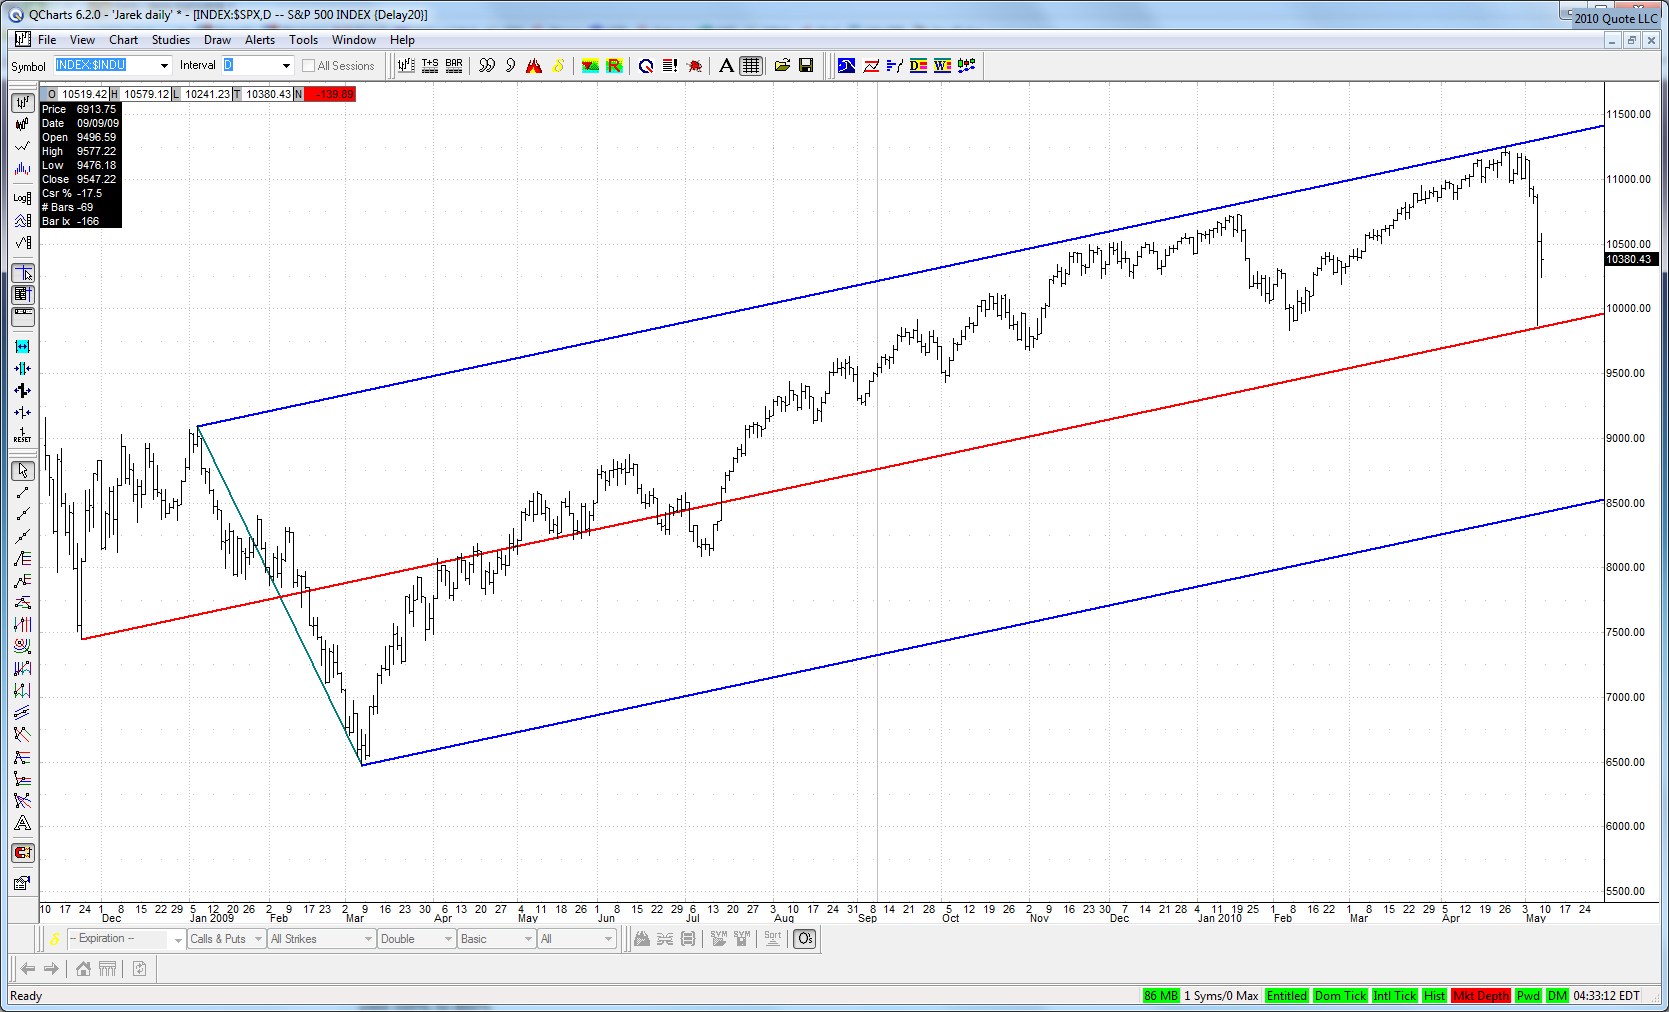
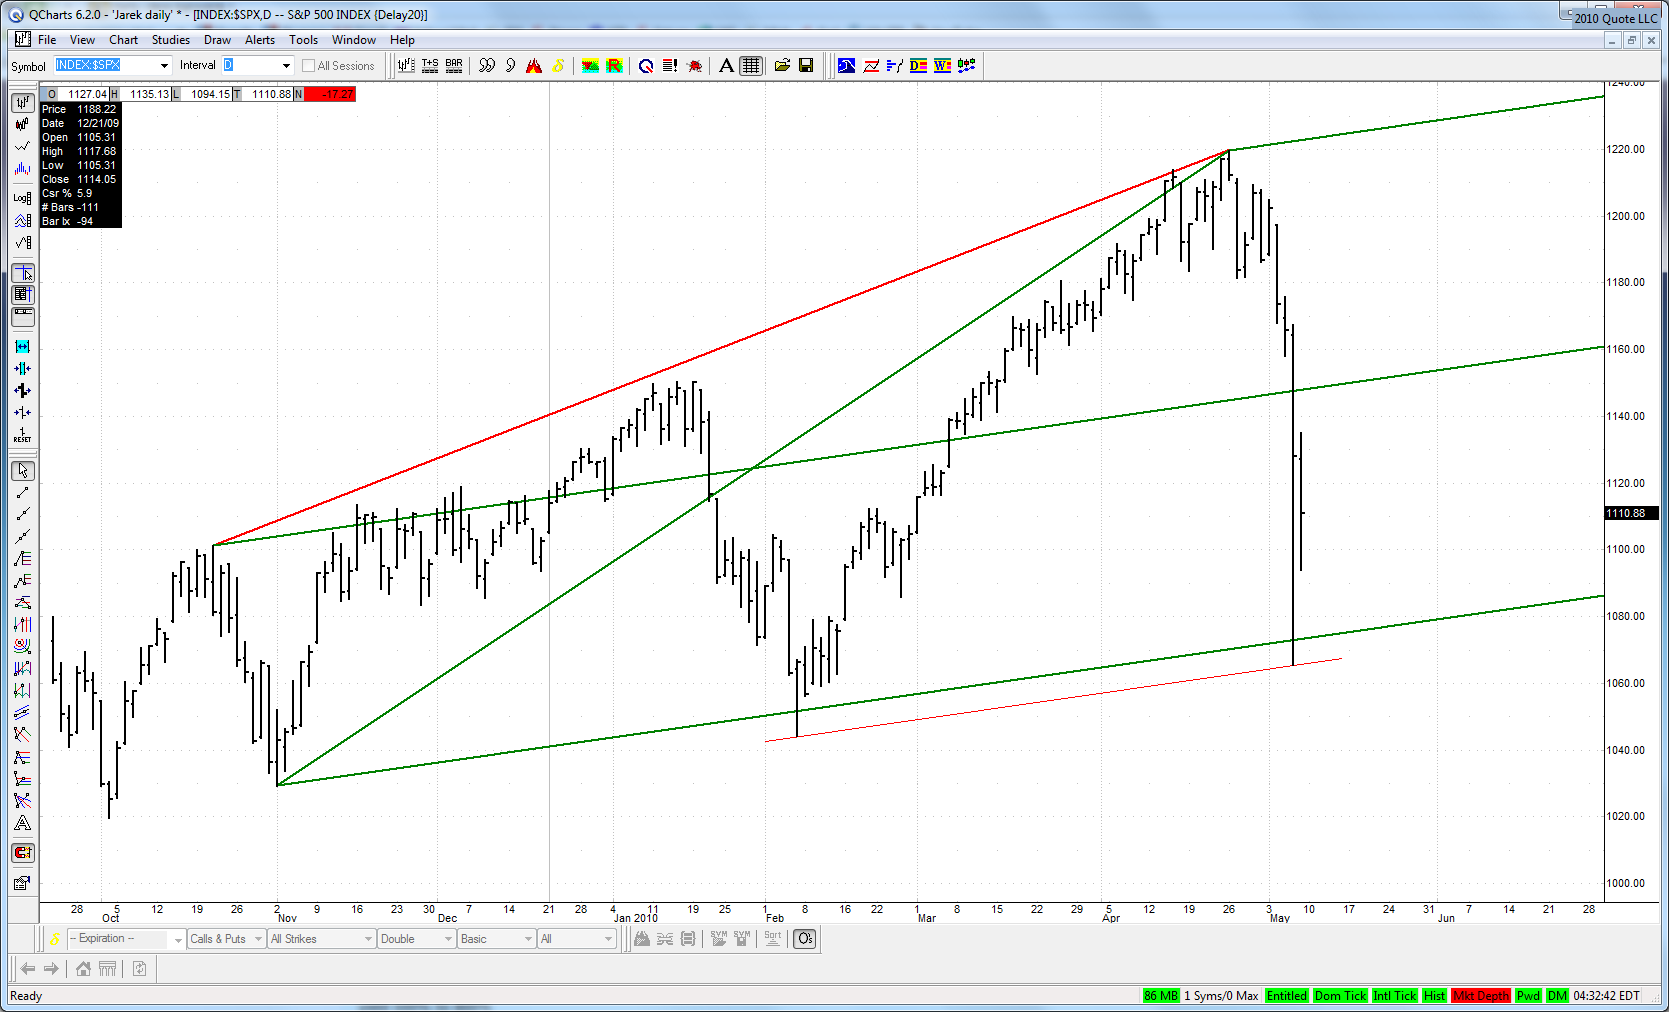
Here are two interesting long term charts of main indexes:
Isn't it amazing that what seemed to be a disorganized collapse reversed dramatically exactly where it should according to geometry??
JI
jimkane
Rep: 3,058
Posts: 33,089
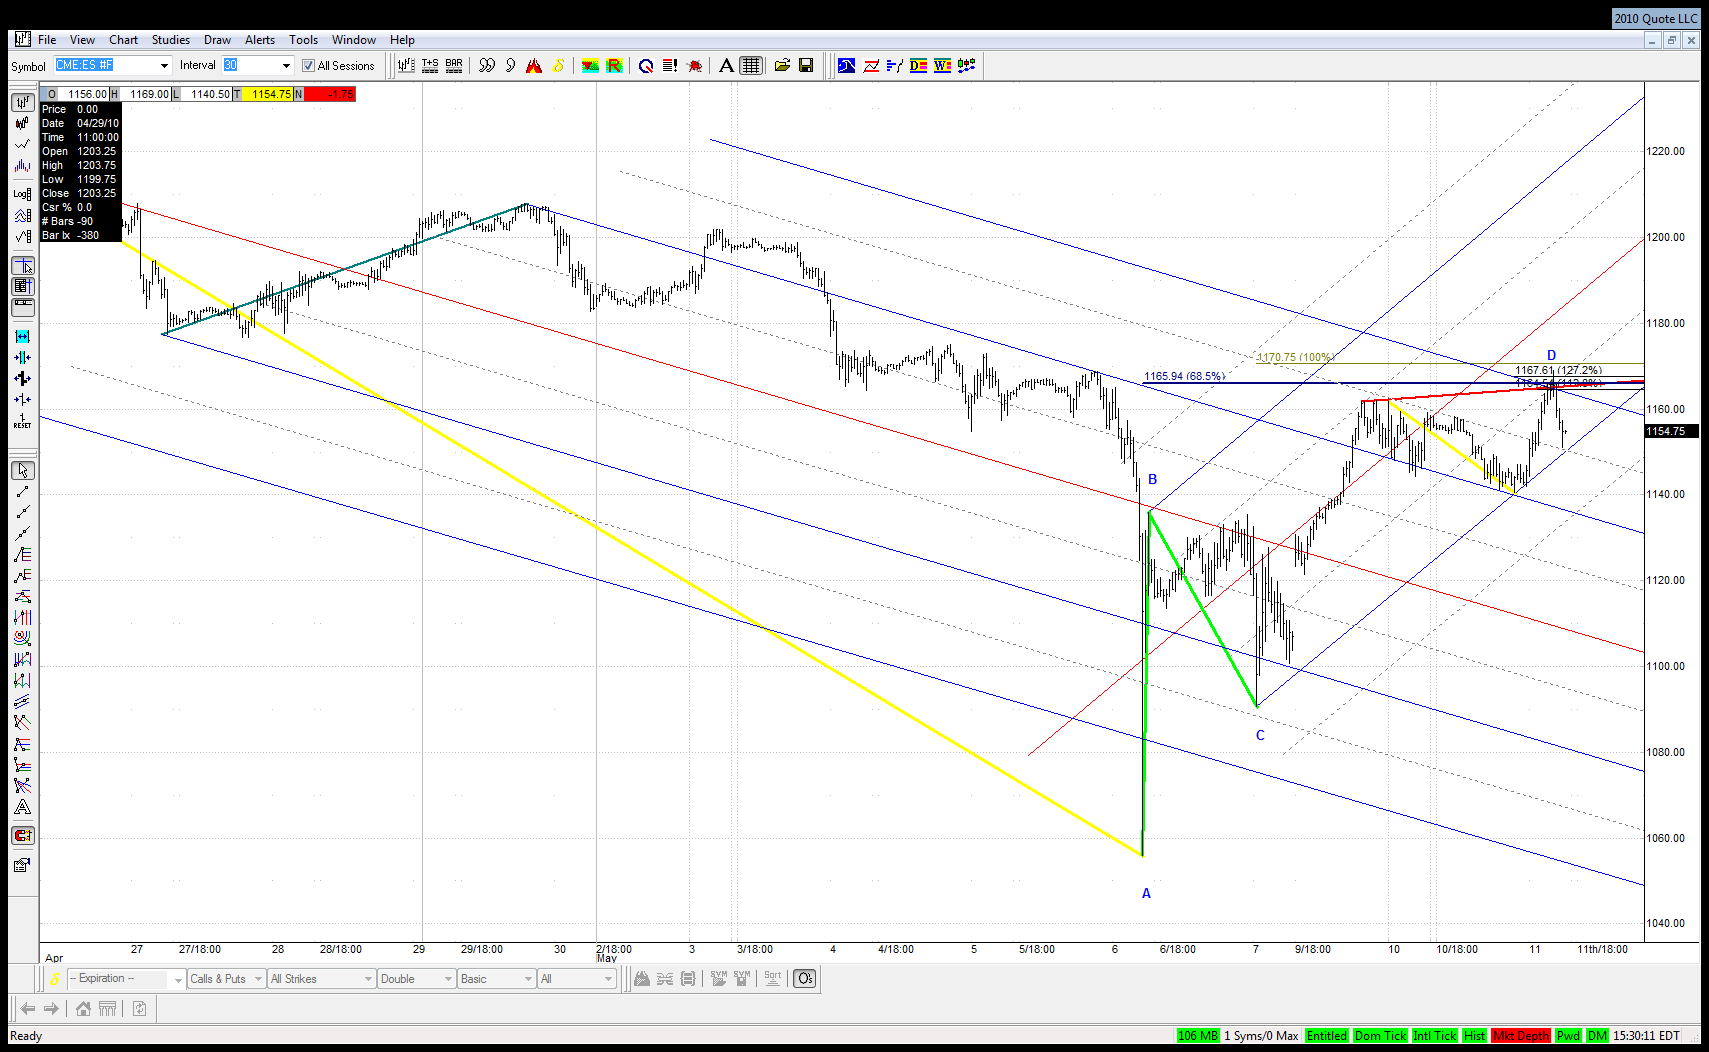
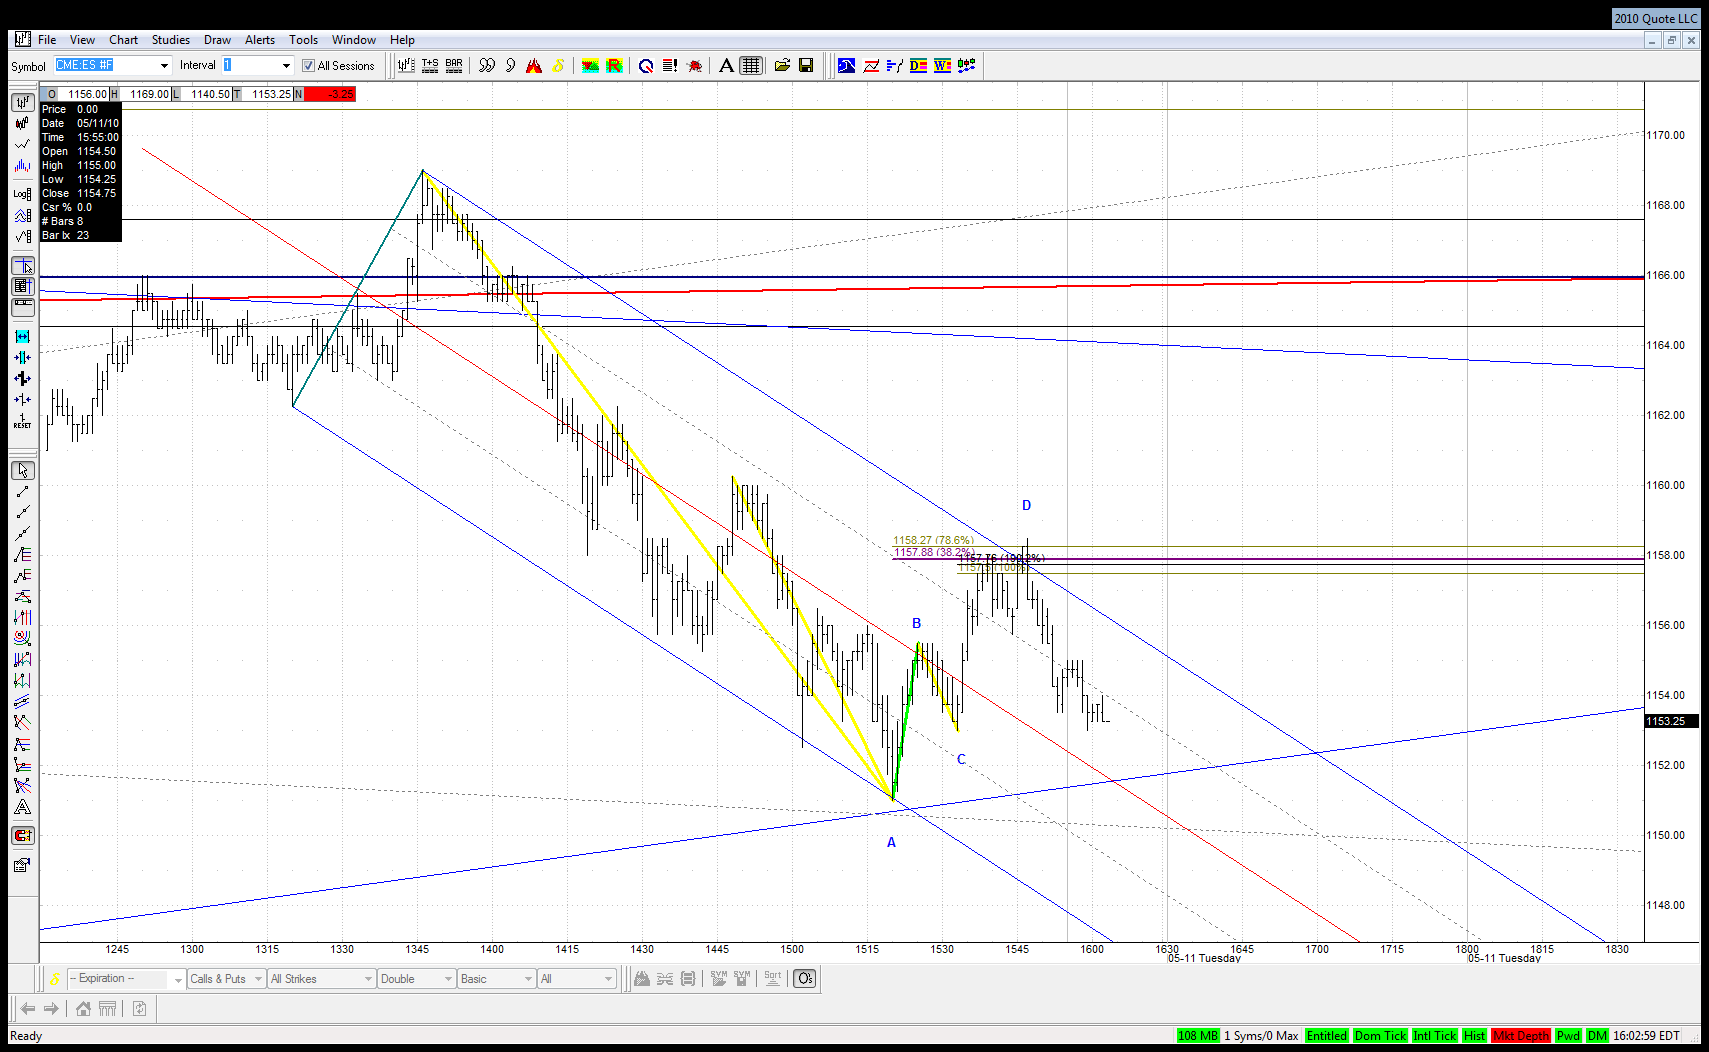
That's what I wanted people to see. We want a bounce here and a 'retest' of that upper line, and then it should get literally crushed in a W3. If they don't just crush it on a bounce in here, then I will totally abandon that scenario. No talking myself into it still being possible that they will roll it down. Of course, if it rolls down from here and takes out that X, that's a sign they may be headed down. I can't tell you how much I wish the bear was back and we can look back on this chart at say SP 700 and show how you posted this as it was unfolding. But, that's as likely, I guess, as my wish to date a Playboy model back when I was 19... Sure would be cool, though.
JI
jimkane
Rep: 3,058
Posts: 33,089
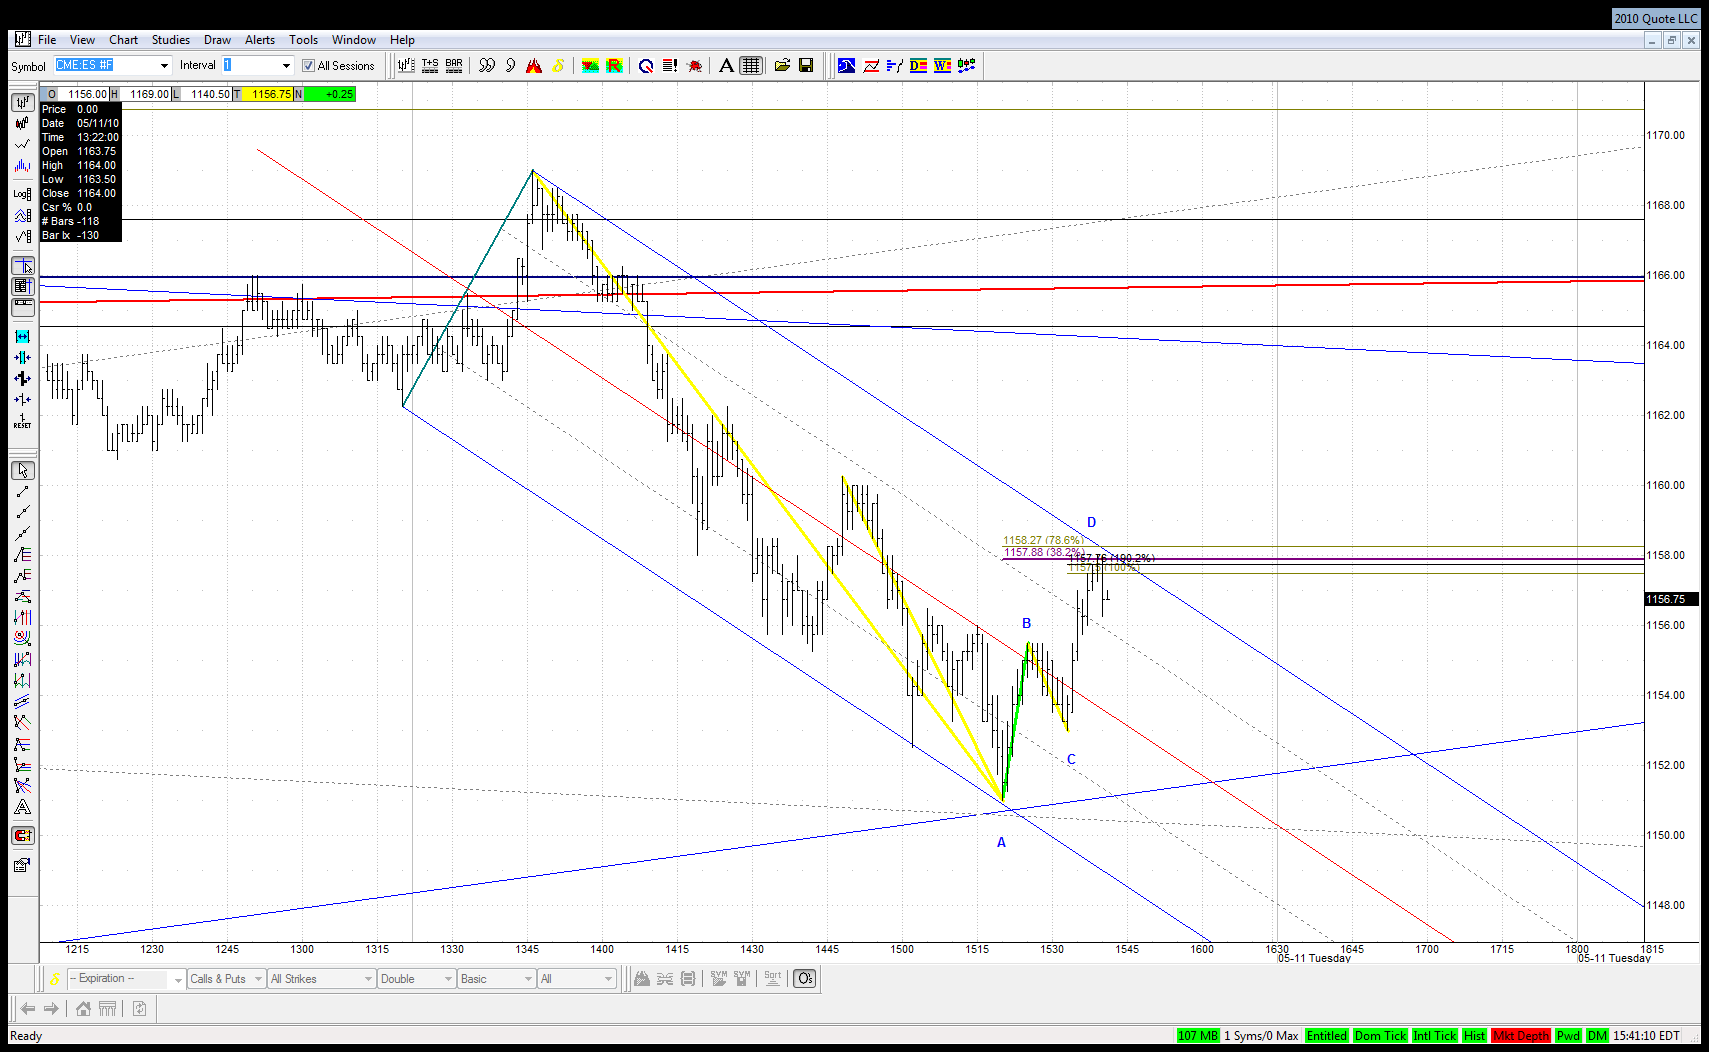
Notice the ABCD here at a .382 and key line. If this gives way back up, your line comes in at about the .618, again that key 1162. Another failure there would demoralize them, and set up the W3. This is exciting. But, will your line hold, and will it actually happen? Probably not...
JI
jimkane
Rep: 3,058
Posts: 33,089
How funny, your post came in under a minute before mine hit. Yes, that's what I was describing. Excellent.
JA
jarek
Rep: 94
Posts: 3,474
Originally posted by jimkane
... But, that's as likely, I guess, as my wish to date a Playboy model back when I was 19... Sure would be cool, though.
JI
jimkane
Rep: 3,058
Posts: 33,089
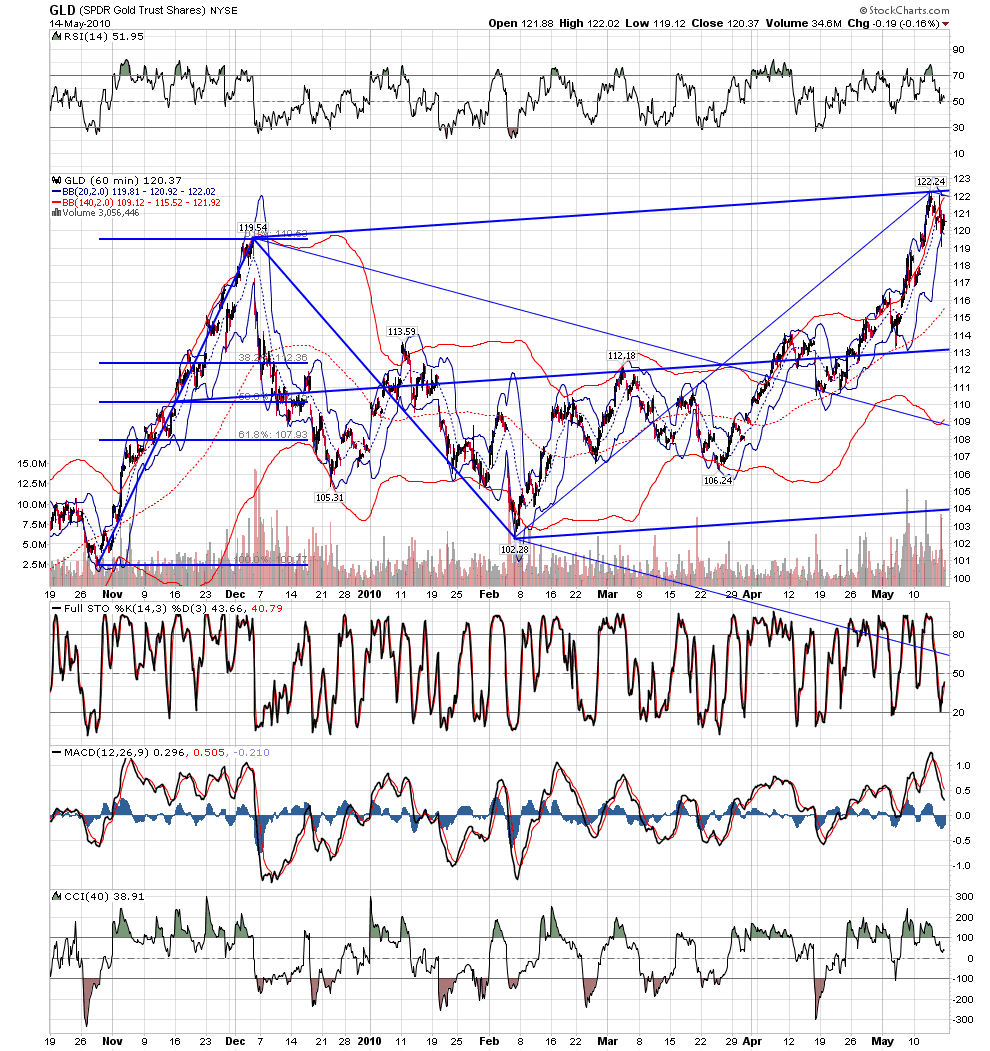
Stopped it dead and rolled it down. Maybe just for now, but look how this thing 'sees' the areas we come up with.
JI
jimkane
Rep: 3,058
Posts: 33,089
C'mon, baby, sell hard into the close. No .786/.886 bounce here. Gold making another move.